
Tutorials
Read your analytics and reports
Read your AI Agent and project analytics, customise a data dashboard, read the executive report, and ask the Business Agent about your data.
In this tutorial you read your AI Agent's analytics and your project analytics, open and customise a data dashboard, read the AI-generated executive report, and ask the Business Agent (وكيل الأعمال) questions about your data.
Analytics shows data only for the AI Agent selected in the project switcher. Project analytics, Data Dashboards and Executive Reports cover the whole project.
Before you start
- An AI Agent with conversations.
- The right project and AI Agent selected in the project switcher. See Dashboard tour.
A. Performance
In the sidebar, open Performance (الأداء) and choose Analytics (تحليلات).
The AI Agent analytics (تحليلات موظف الذكاء الاصطناعي) page opens for the AI Agent selected in the project switcher.
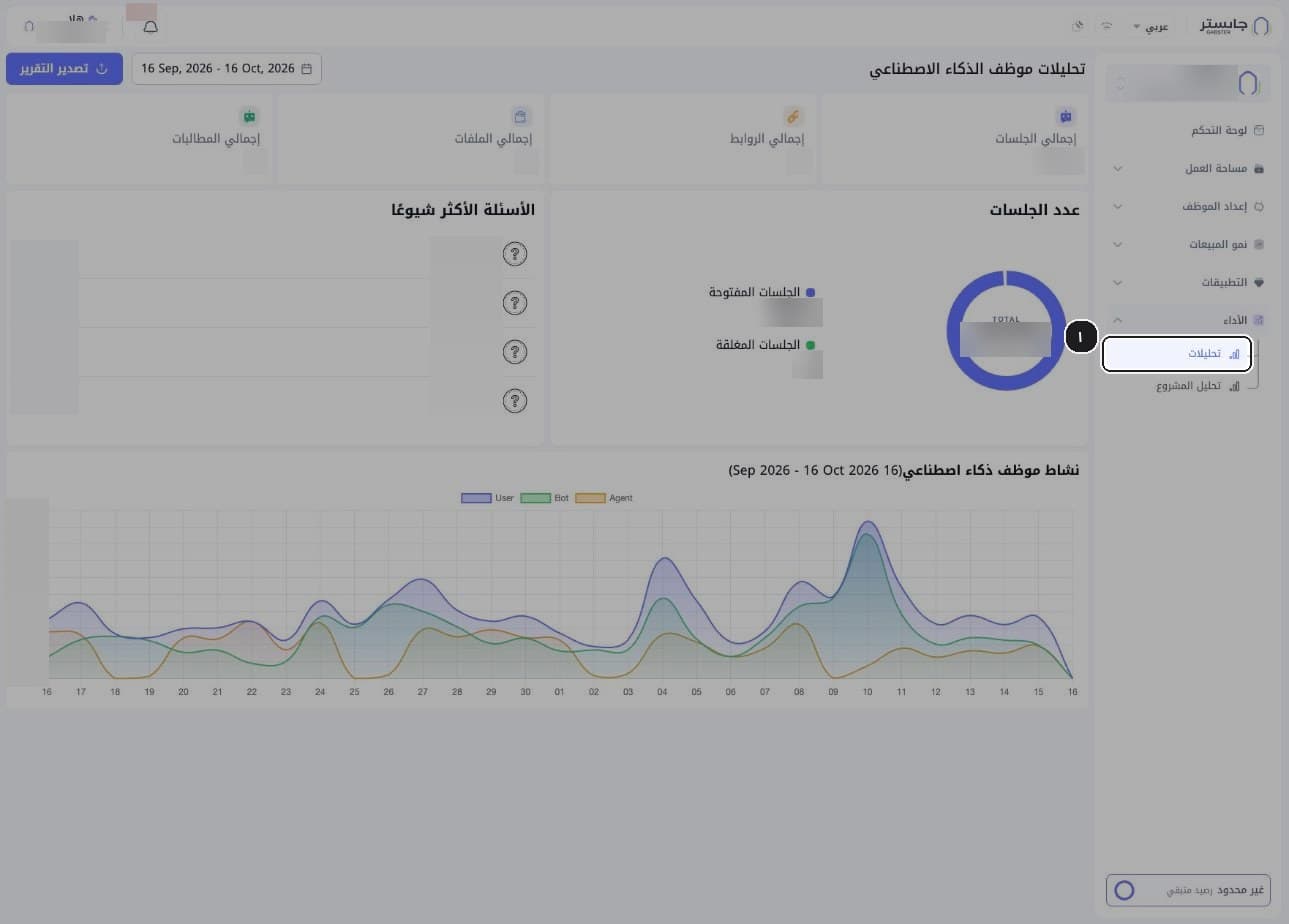
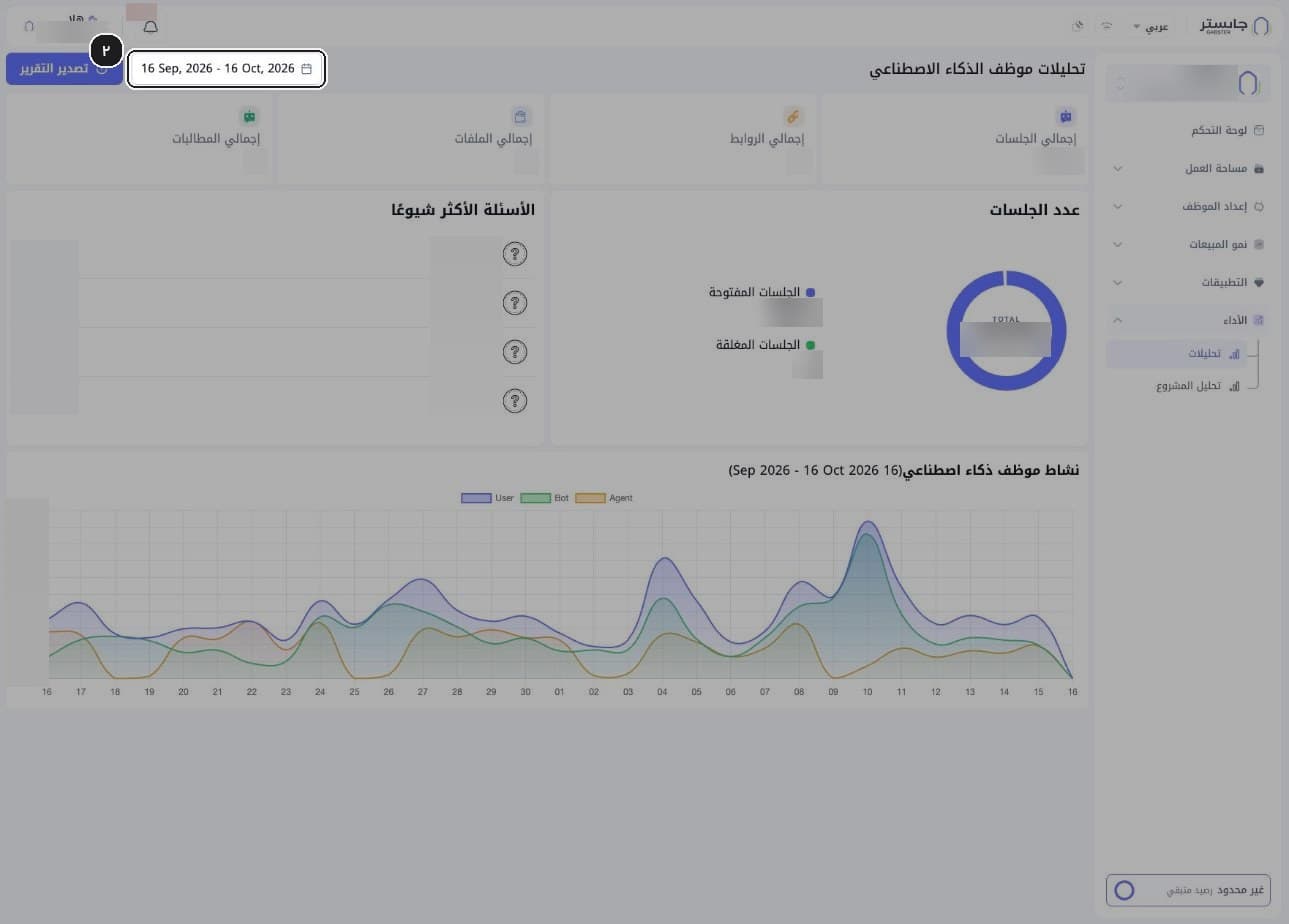
Check the date range at the top of the page.
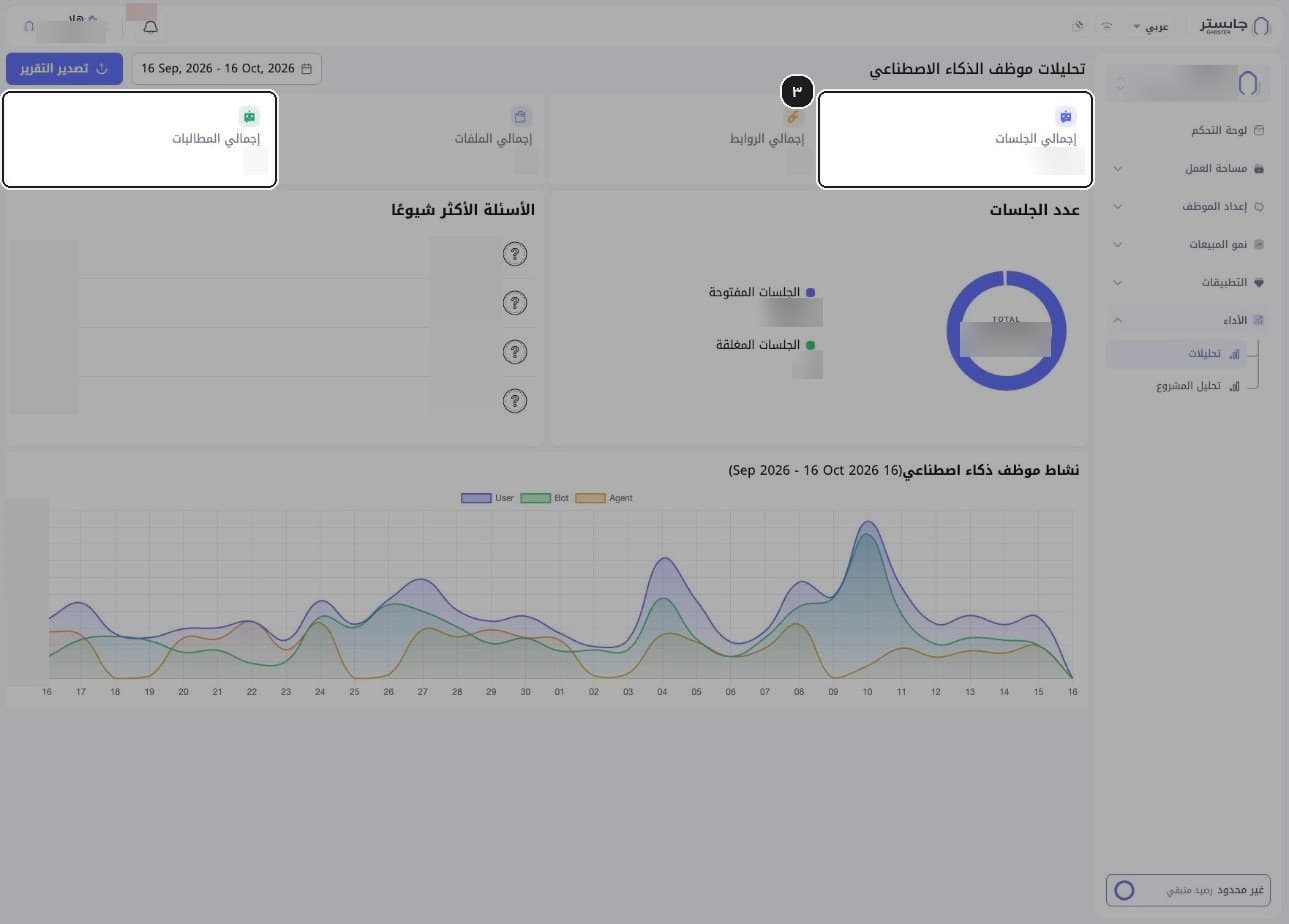
Read the totals: Total sessions (إجمالي الجلسات), Total links (إجمالي الروابط), Total files (إجمالي الملفات) and Total prompts (إجمالي المطالبات).
Links and files are the web links and files in this AI Agent's Knowledge Base, prompts are its quick prompts, and each total counts what was created in the selected range.
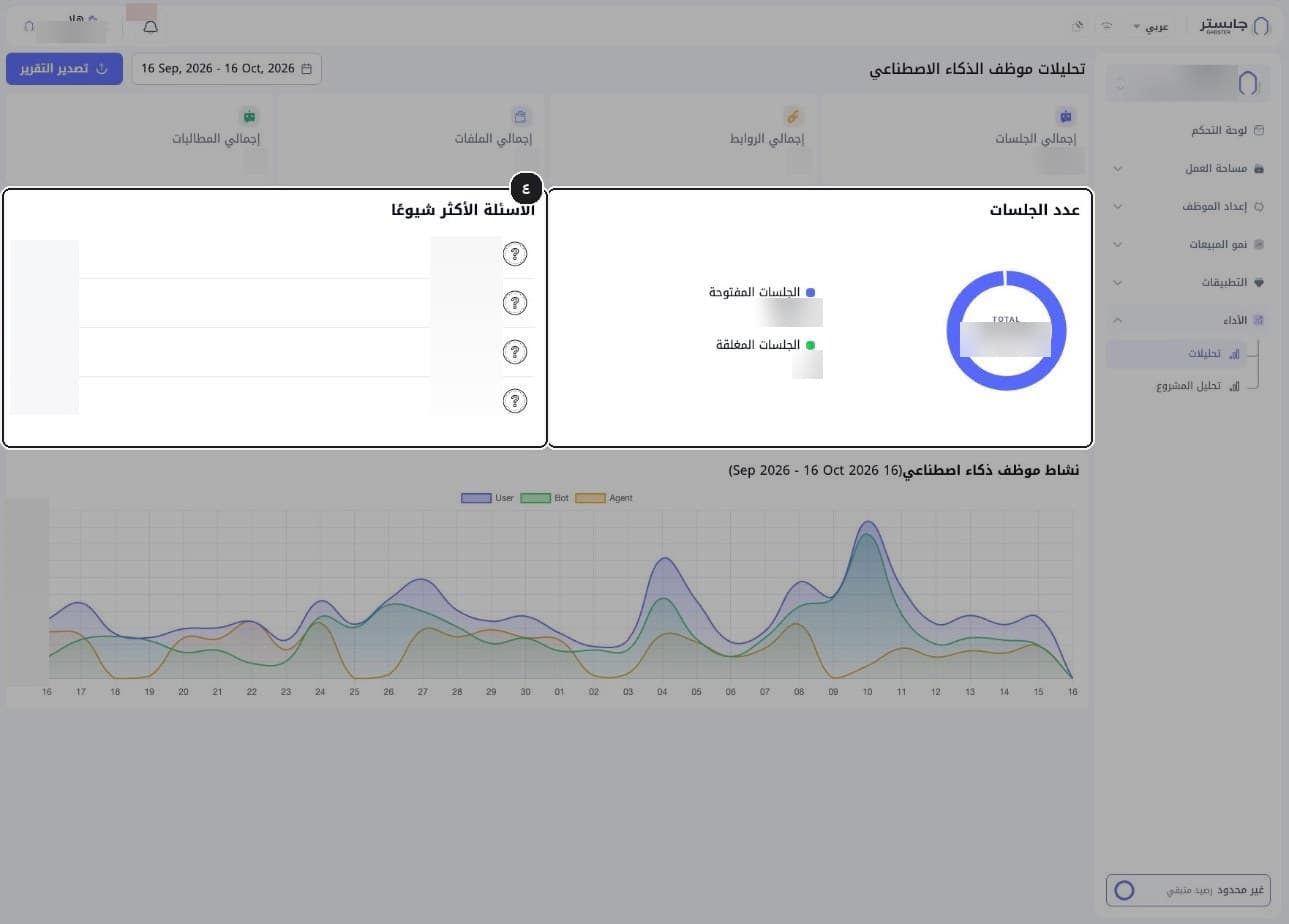
Read the Number of sessions (عدد الجلسات) chart, which splits sessions into open and closed, and the Most frequent questions (الأسئلة الأكثر شيوعًا) list, ranked by how often each was asked.
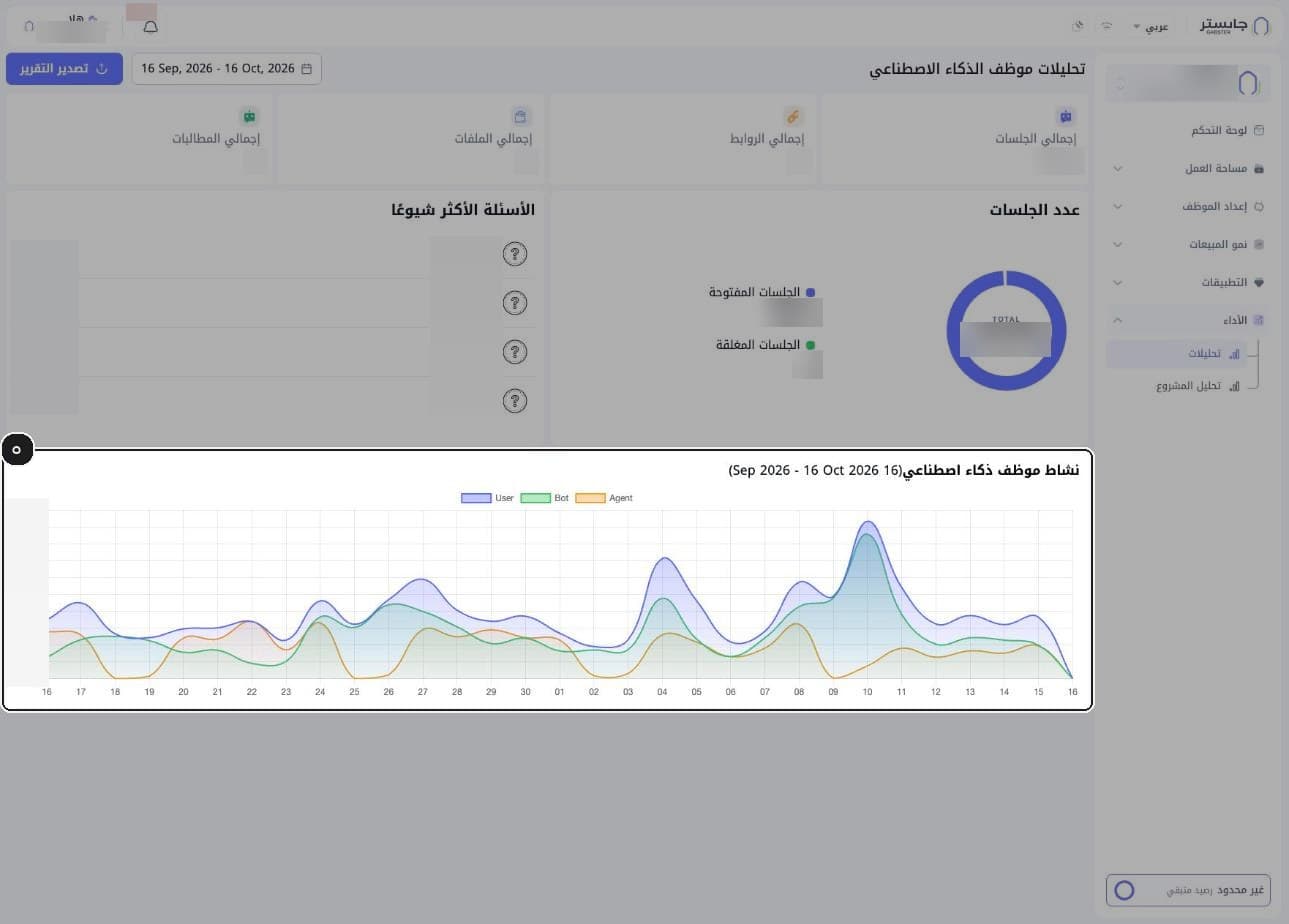
Read the daily activity chart. It has three series: User, Bot and Agent.
User counts customer messages, Bot your AI Agent's replies and Agent staff messages.
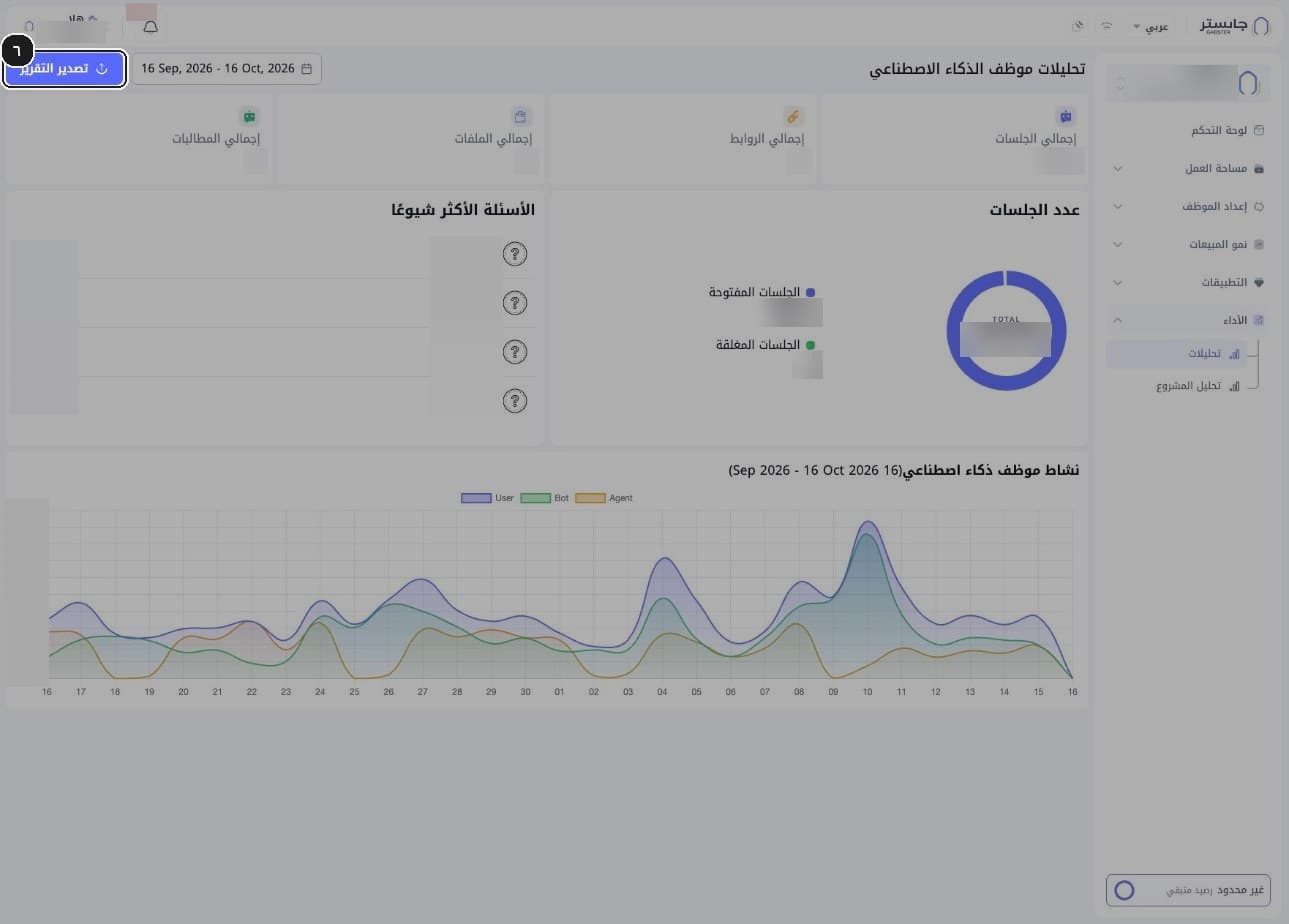
Click Export report (تصدير التقرير) to export a report for the selected range.
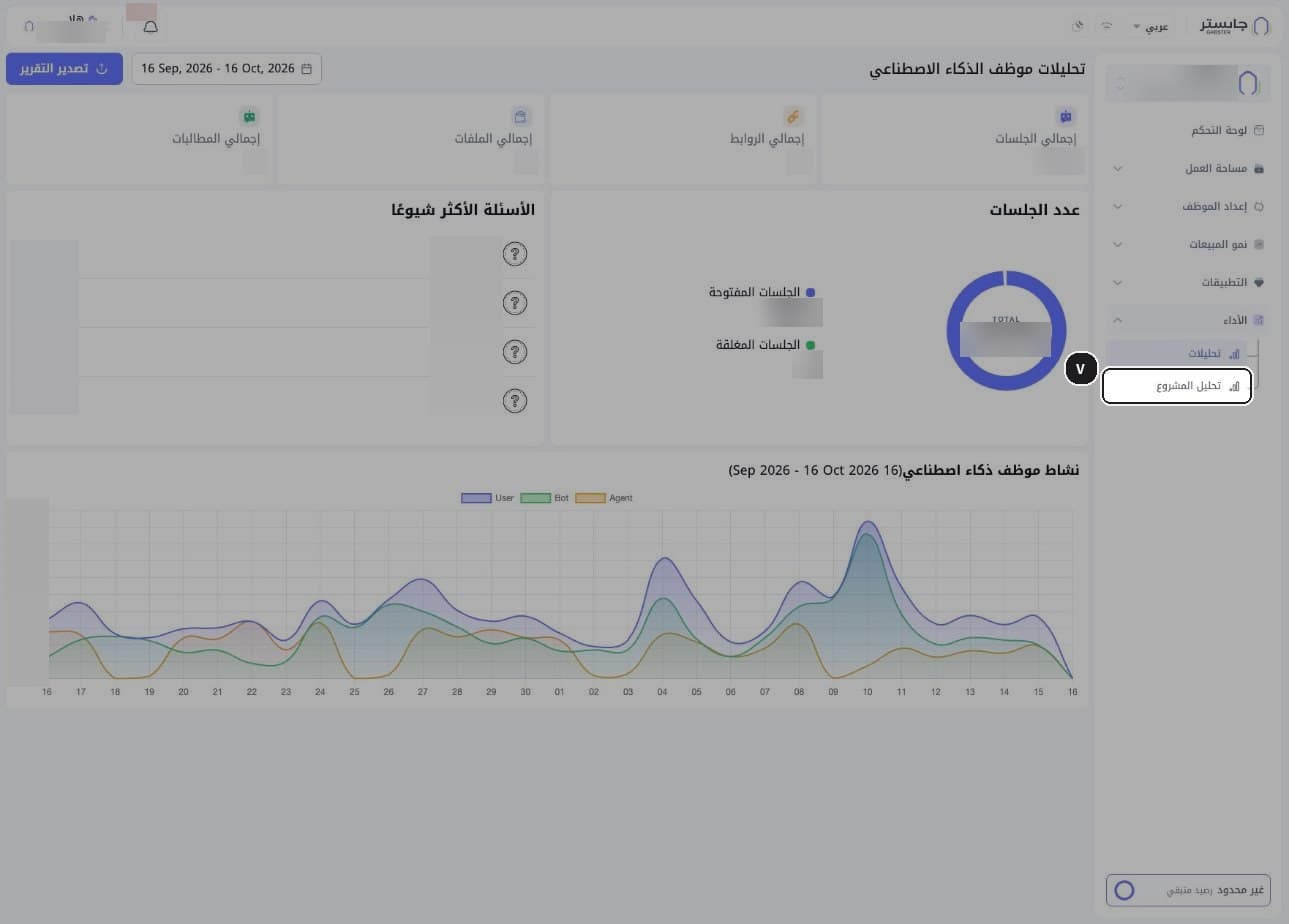
In the sidebar, open Project analytics (تحليل المشروع).
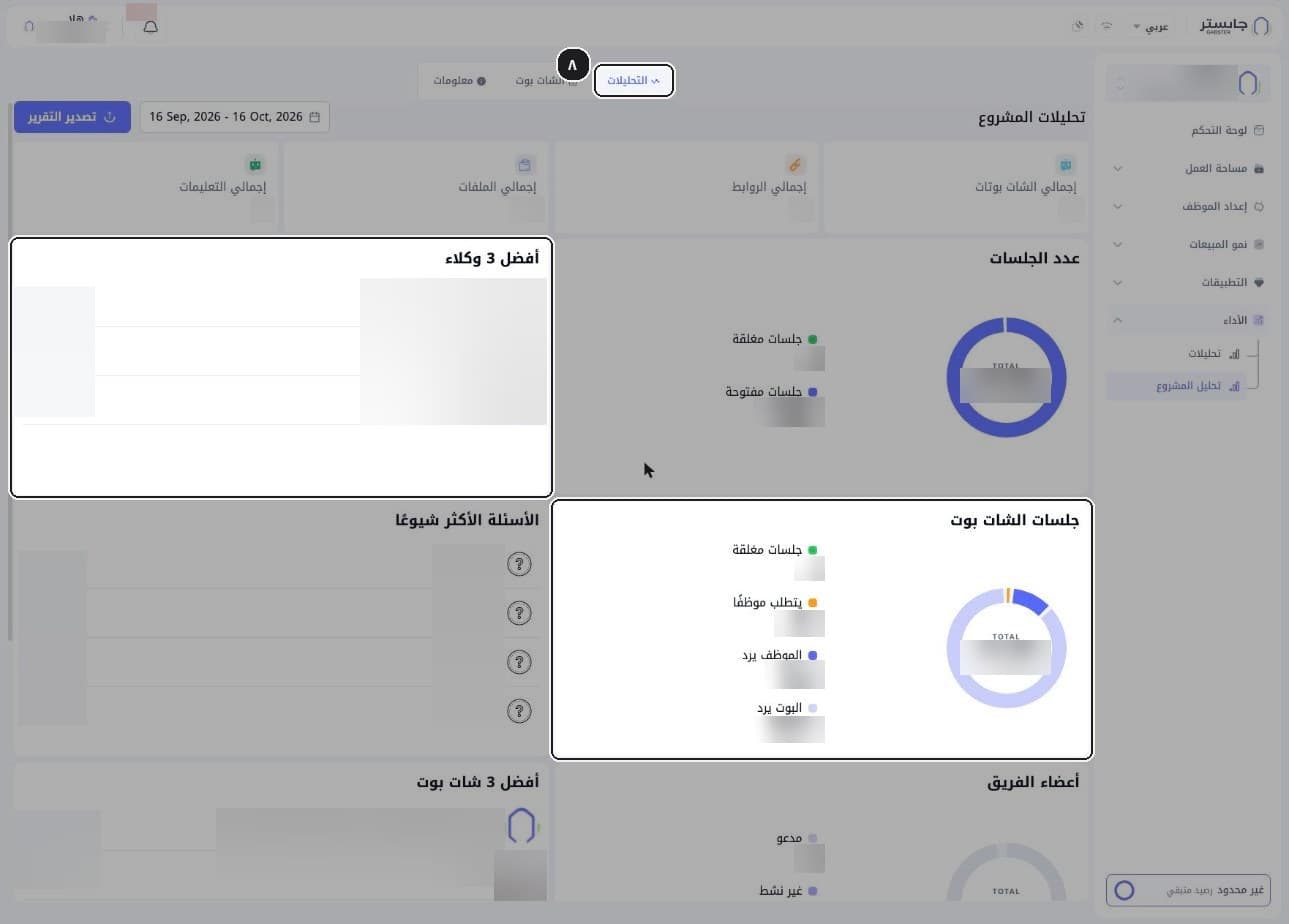
The page opens on the Analytics (التحليلات) tab.
Read the project totals and the AI Agent sessions (جلسات الشات بوت) chart, which splits sessions into Closed (جلسات مغلقة), Needs a staff member (يتطلب موظفًا), Staff replying (الموظف يرد) and AI Agent replying (البوت يرد). Then read Top 3 staff members (أفضل 3 وكلاء) and Top 3 AI Agents (أفضل 3 شات بوت), ranked by messages.
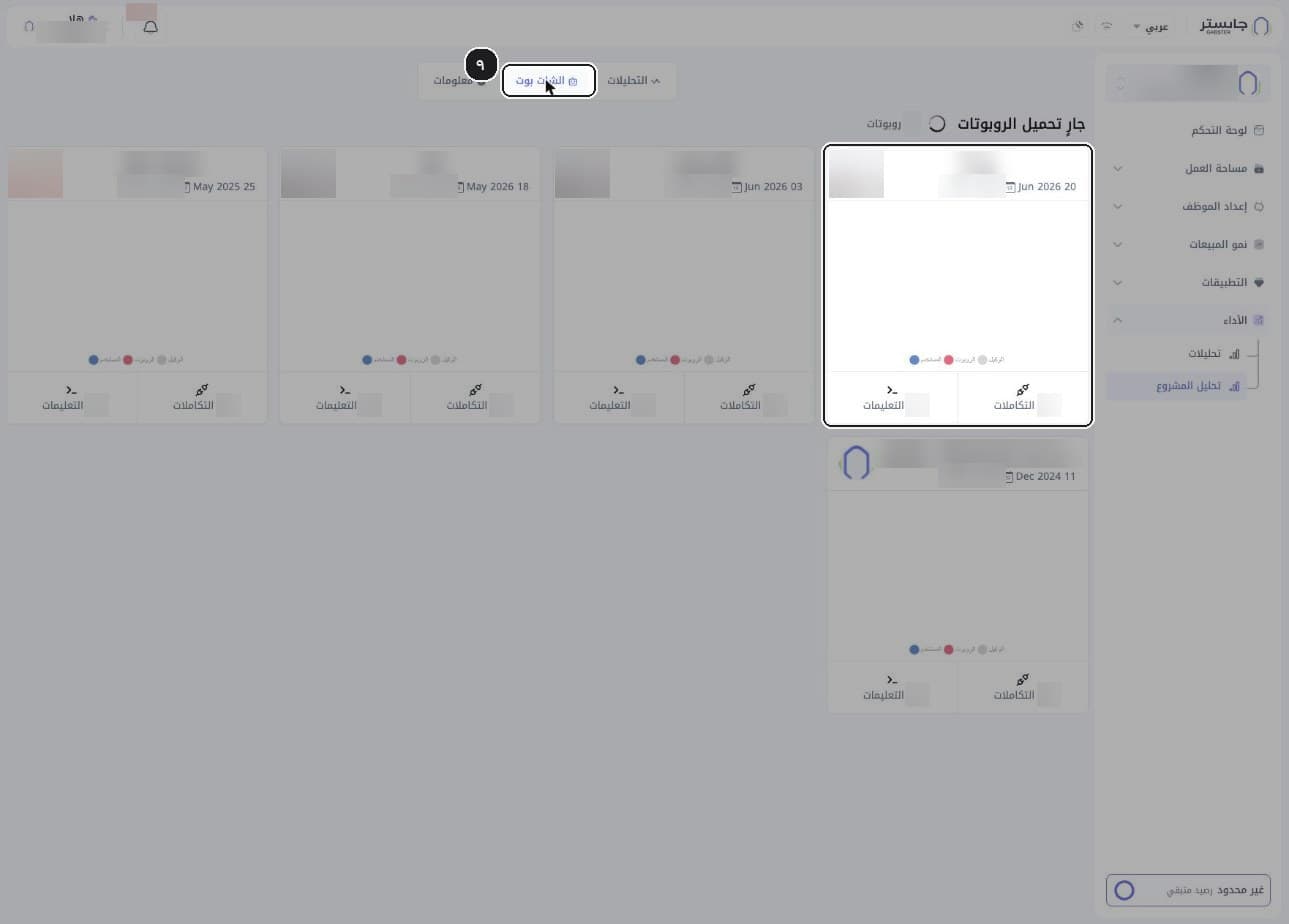
Open the AI Agents (الشات بوت) tab.
Each AI Agent in the project has a card.
Open the Info (معلومات) tab to see the project, organization, user and project-settings cards.
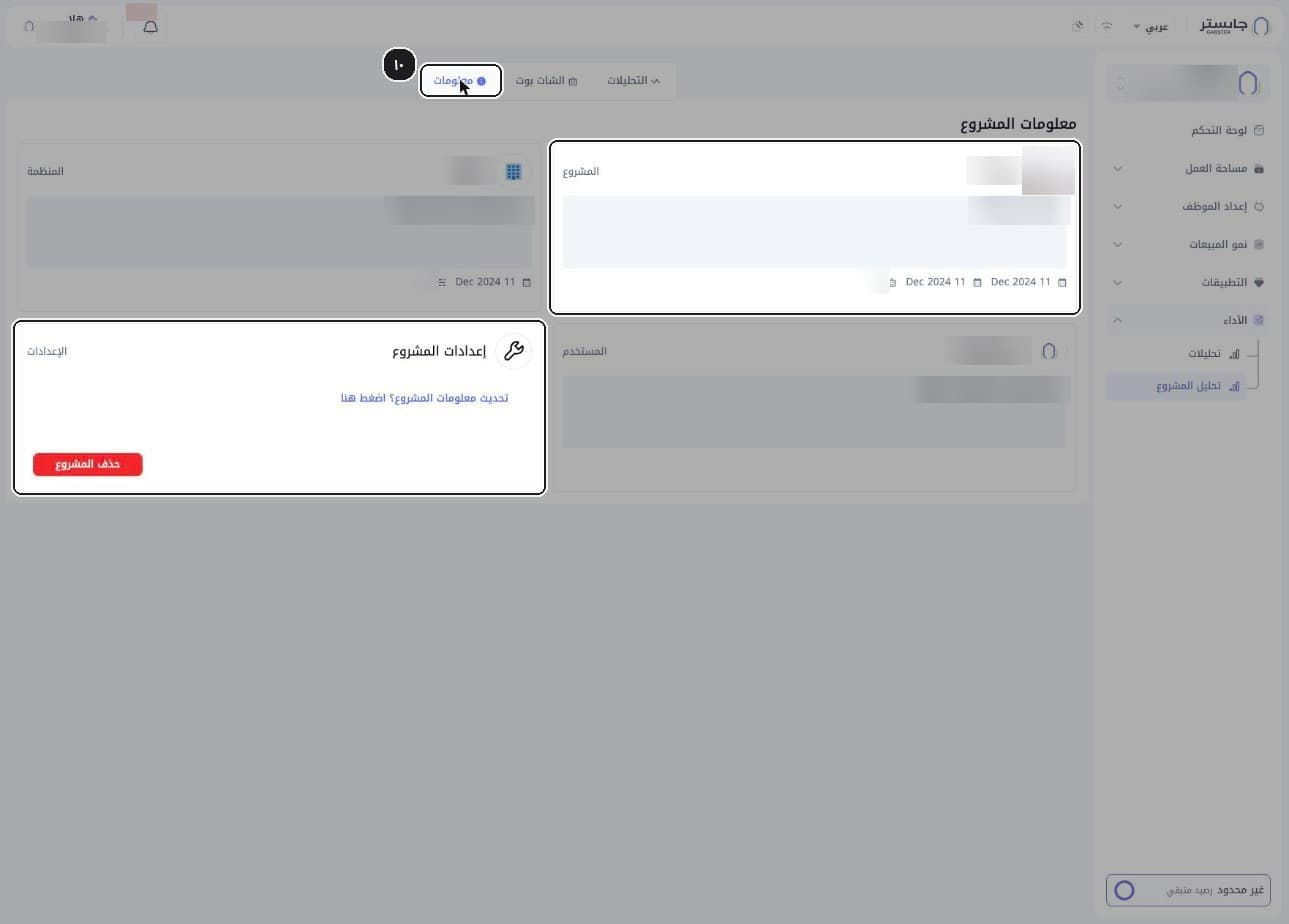
The project-settings card on the Info tab holds the Delete project (حذف المشروع) button. Only click it if you really want to delete the project.
B. Data Dashboards
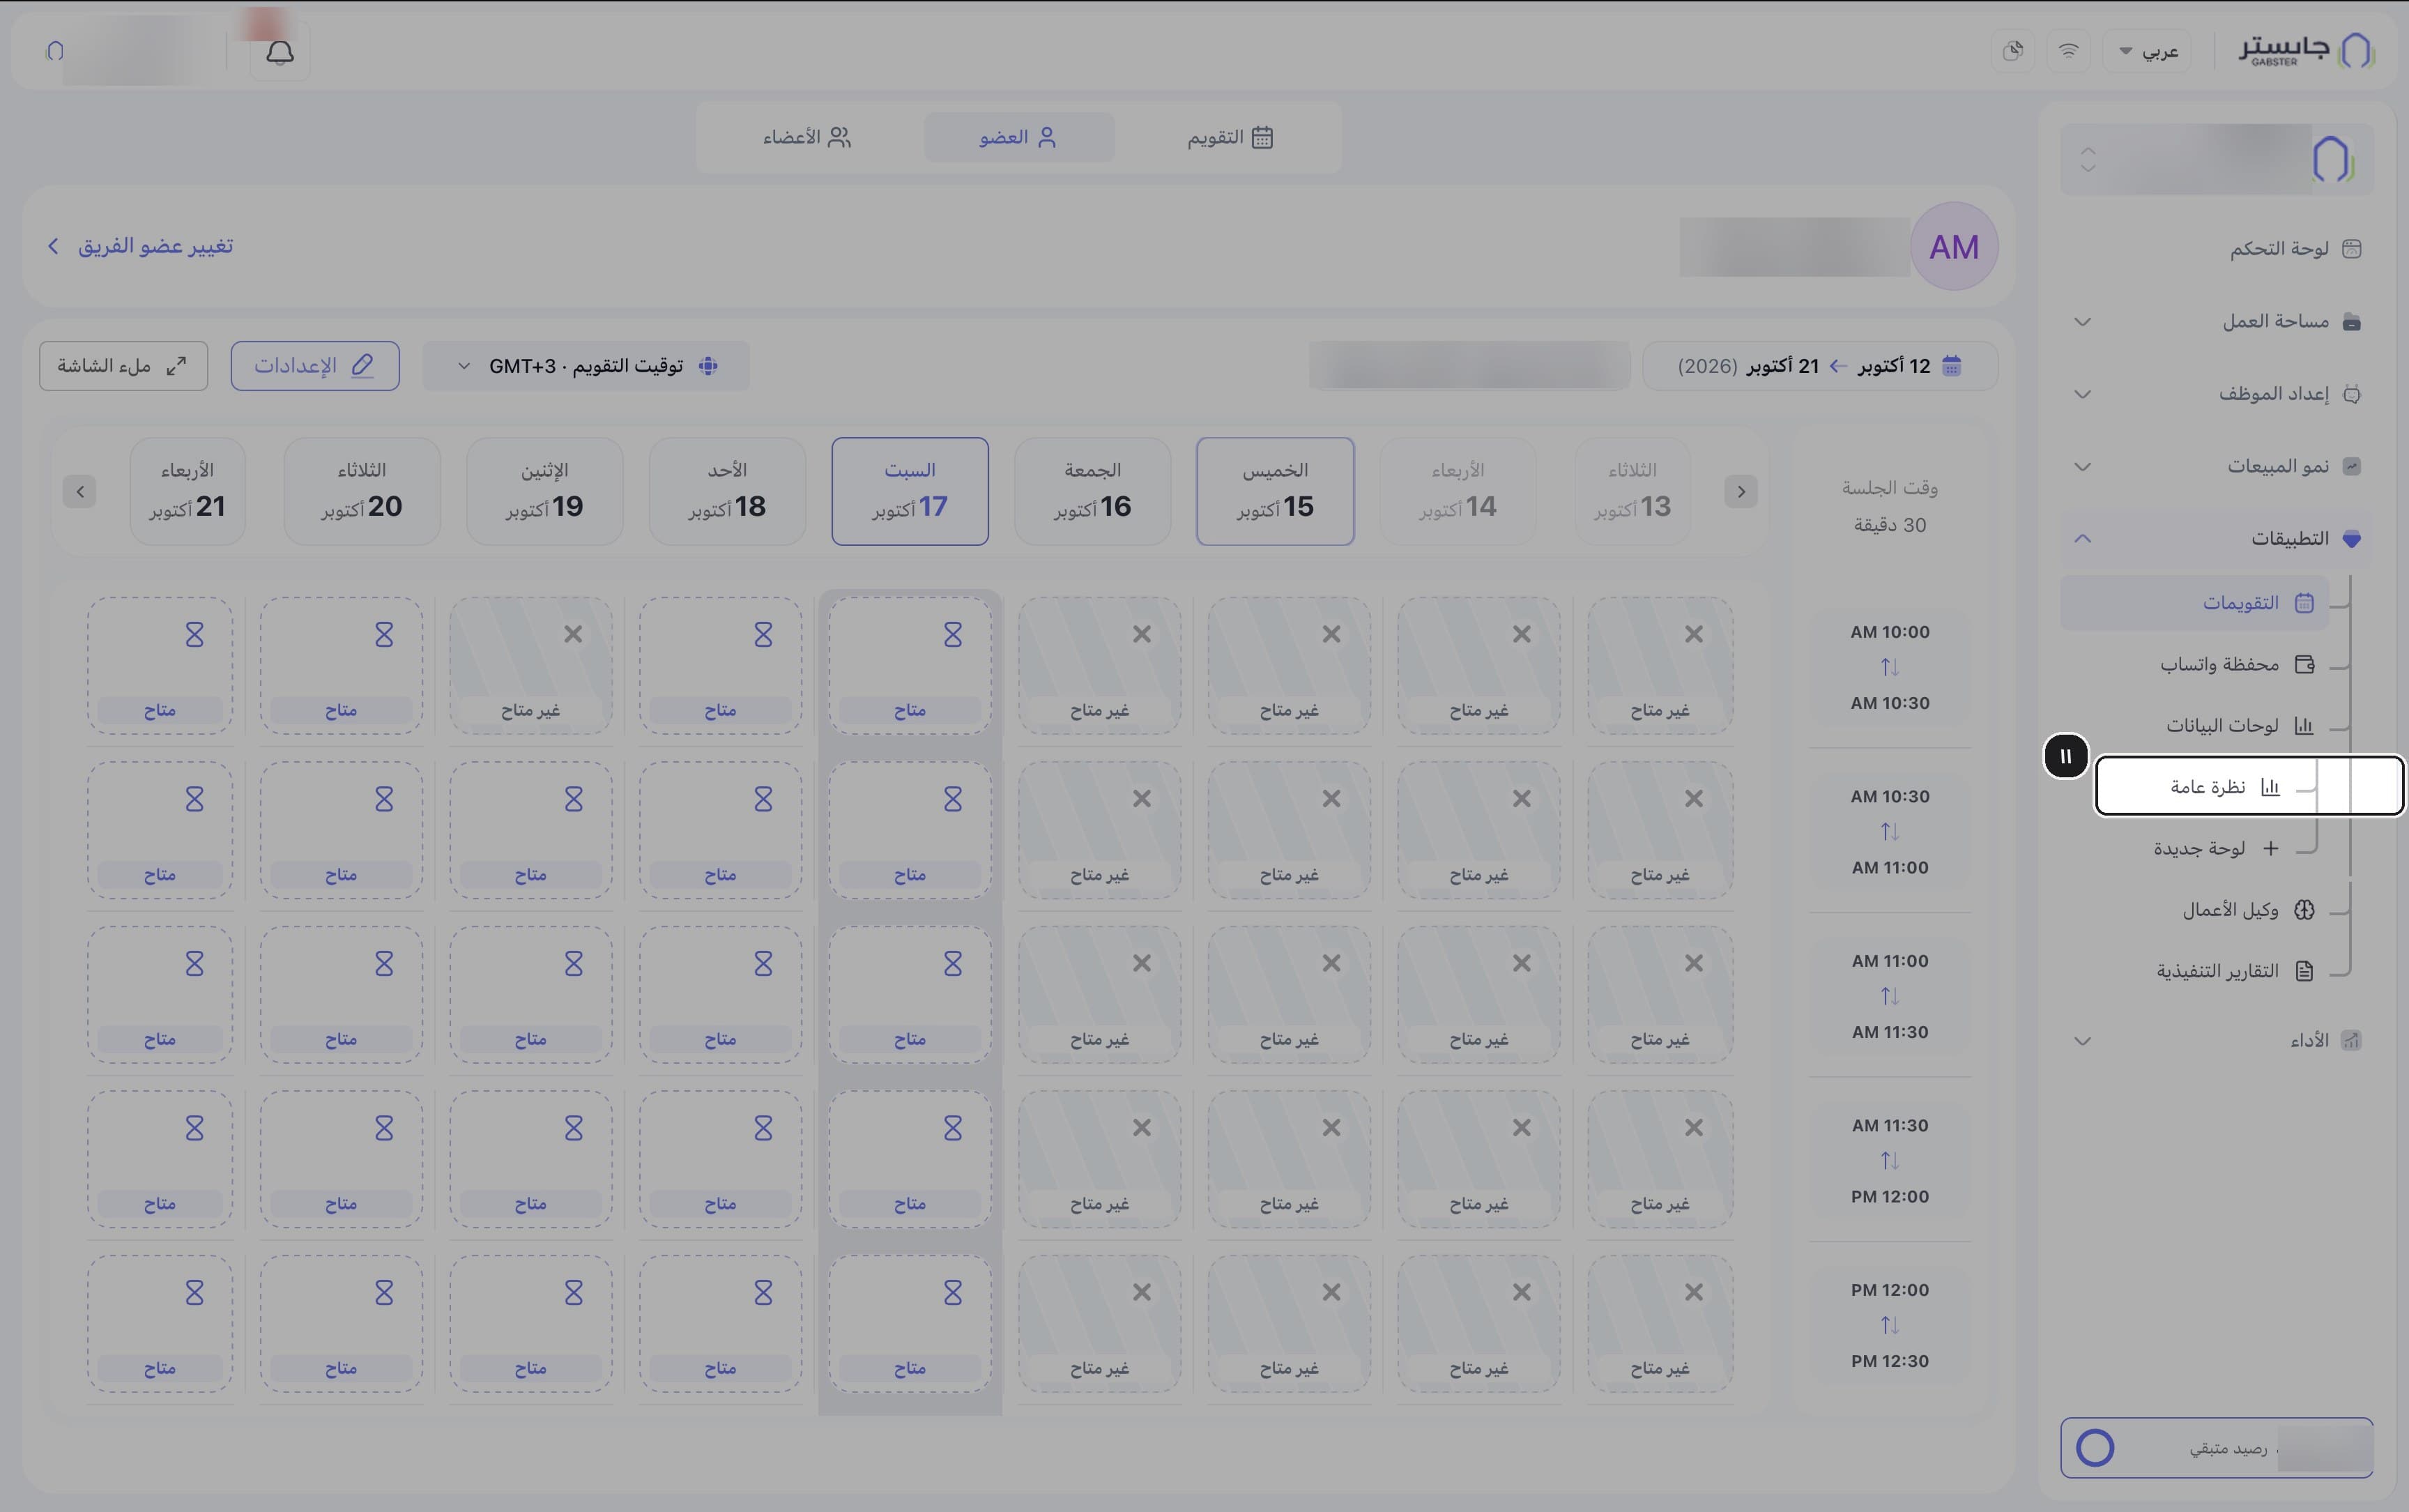
In the sidebar, open Apps (التطبيقات) → Data Dashboards (لوحات البيانات) → Overview (نظرة عامة).
The list of data dashboards appears.
Pick the data period: 7 days (٧ أيام), 14 days (١٤ يوم), 30 days (٣٠ يوم), 90 days (٩٠ يوم) or Custom (مخصص).
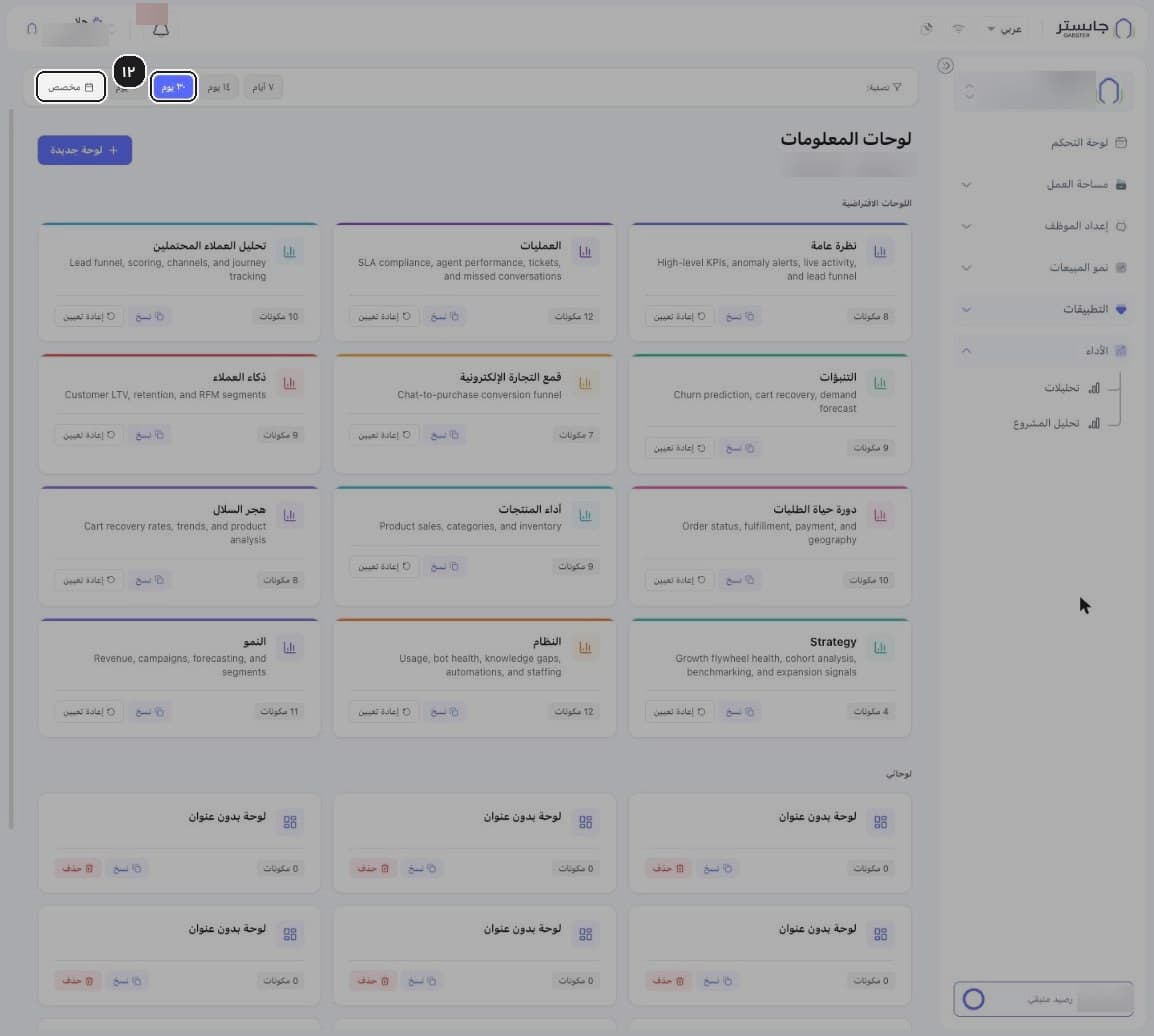
Browse the Default dashboards (اللوحات الافتراضية) and your own under My dashboards (لوحاتي). Each default dashboard shows a description and its number of components, with Copy (نسخ) and Reset (إعادة تعيين); your own show Copy and Delete (حذف).
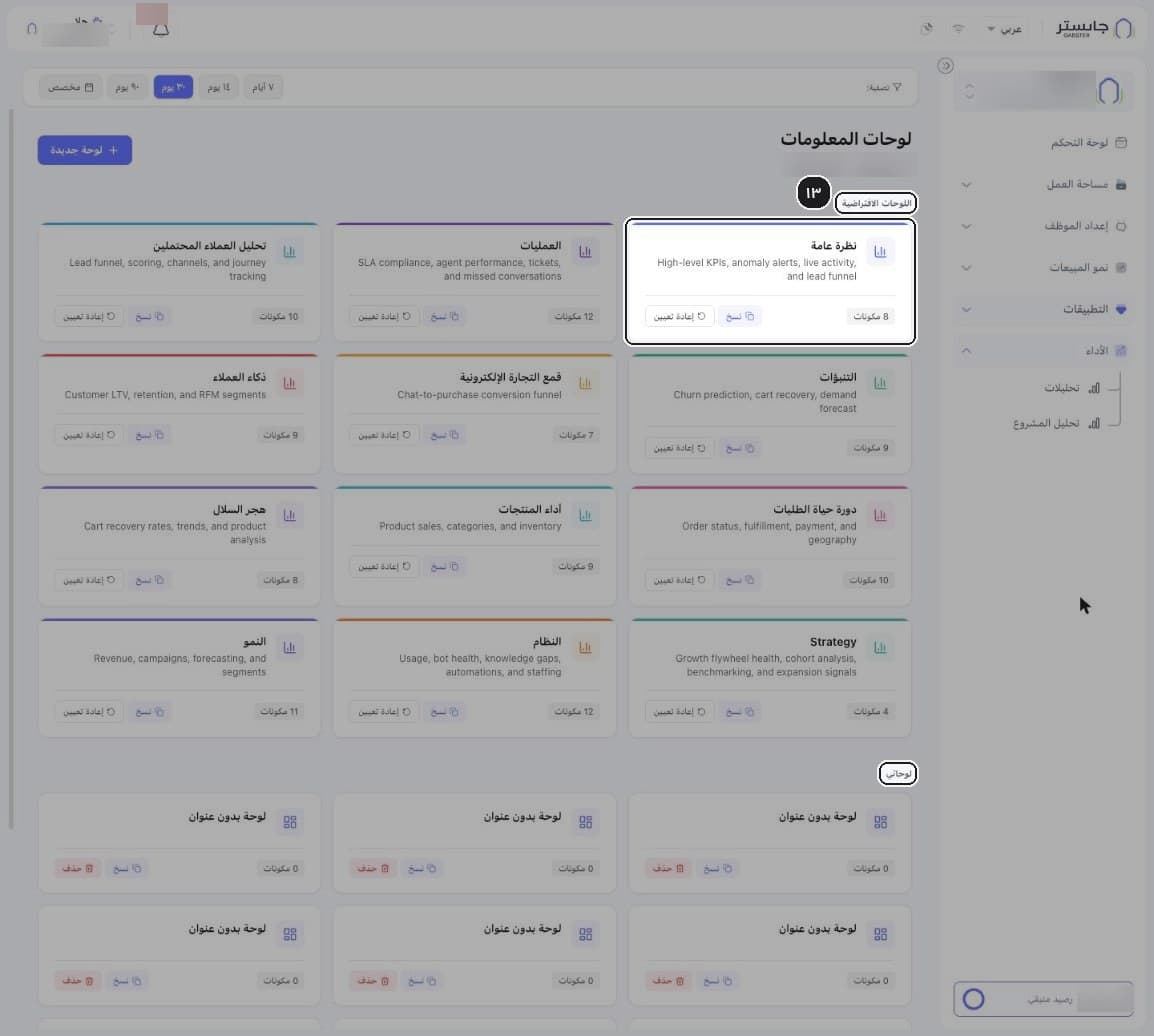
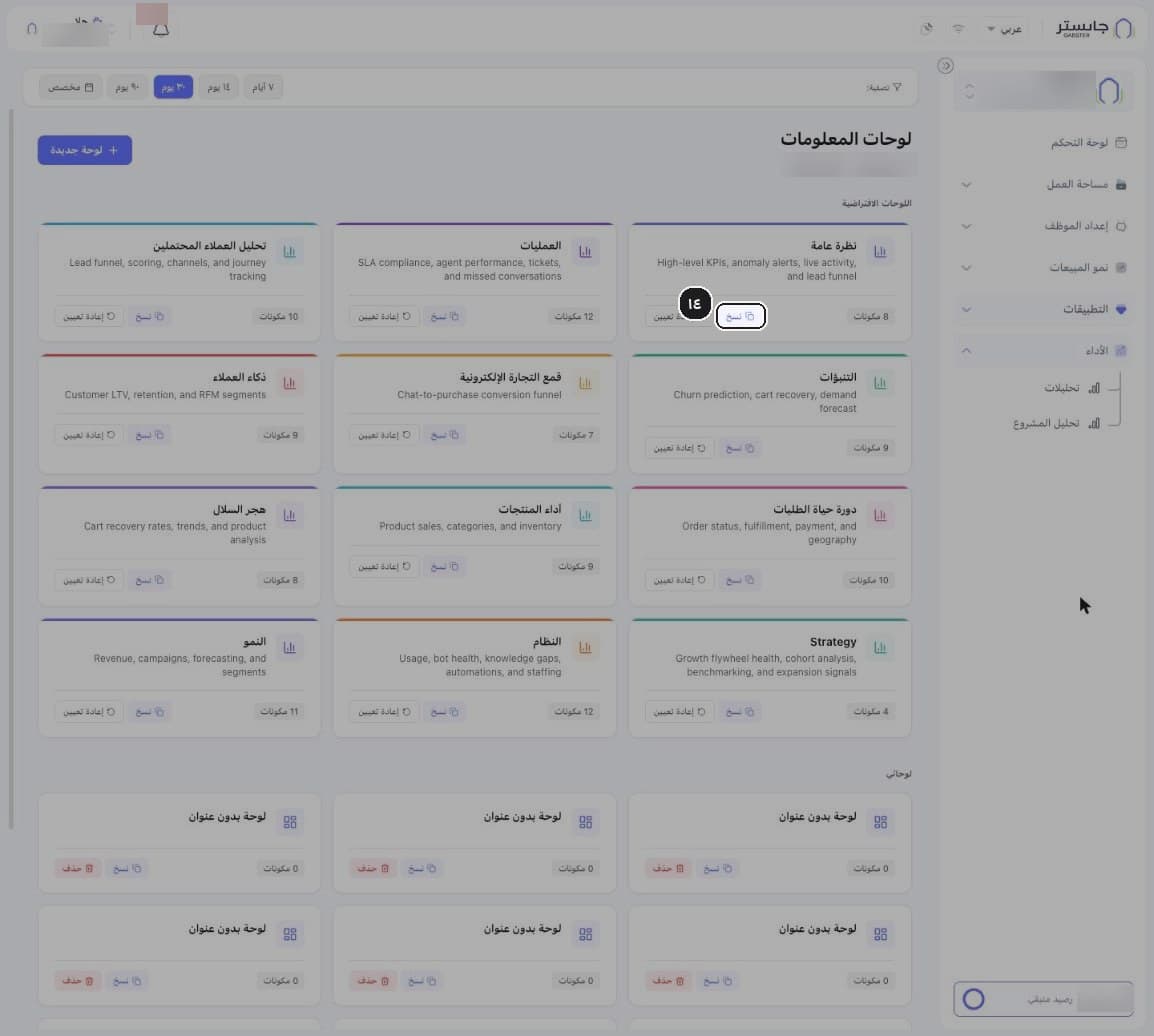
(Optional) Click Copy on a default dashboard to customise a copy of it.
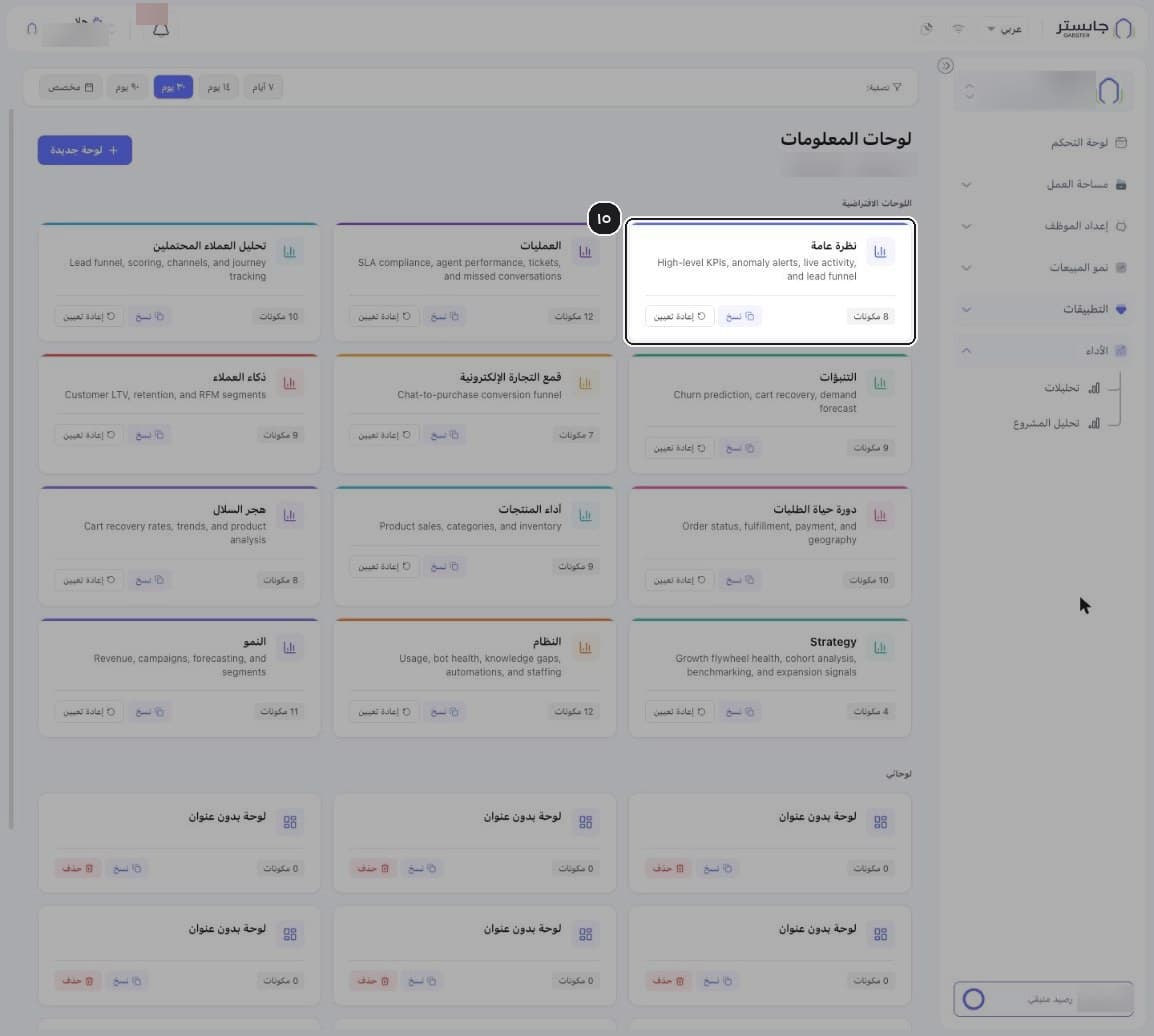
Open a dashboard, such as the default Overview (نظرة عامة).
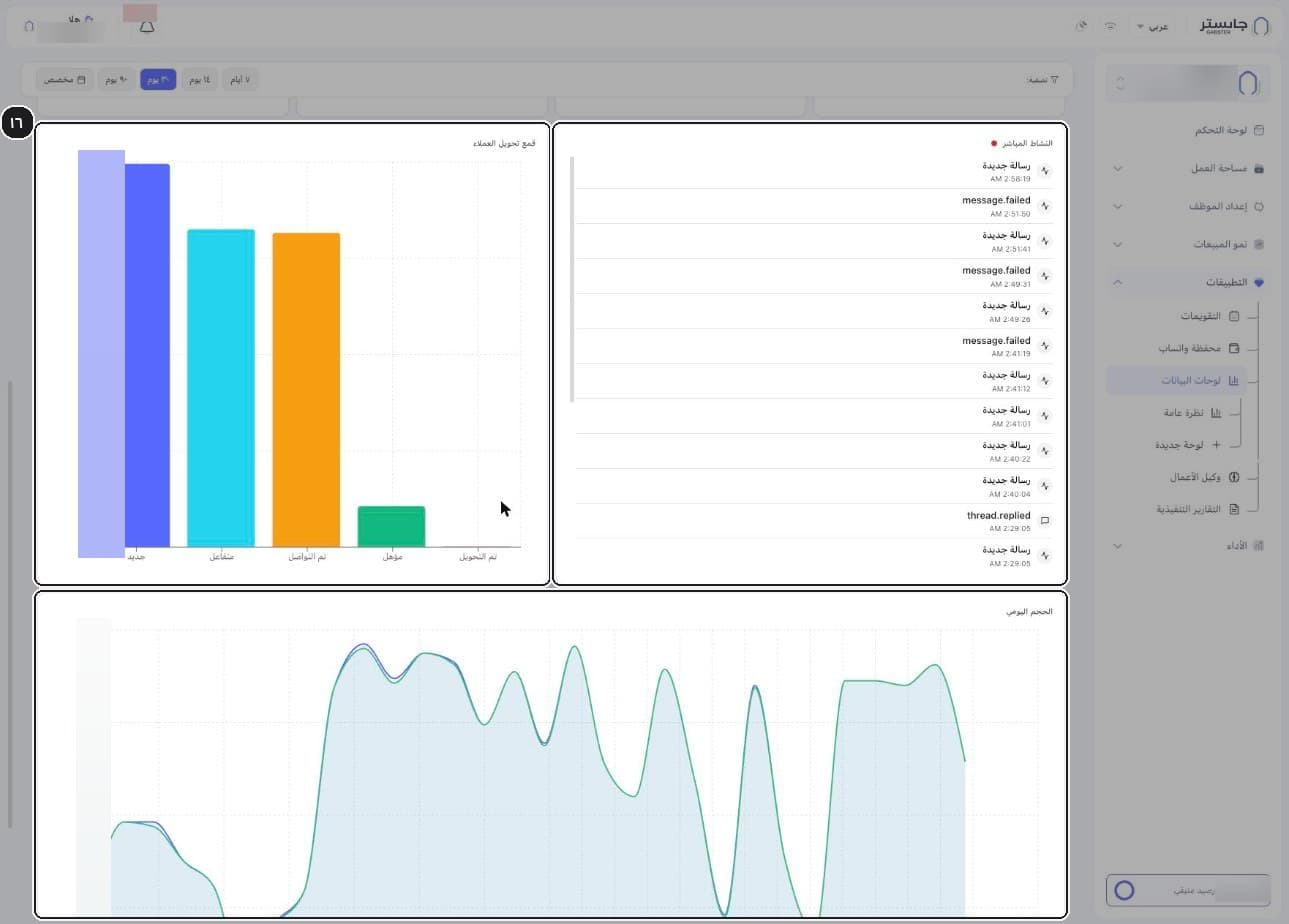
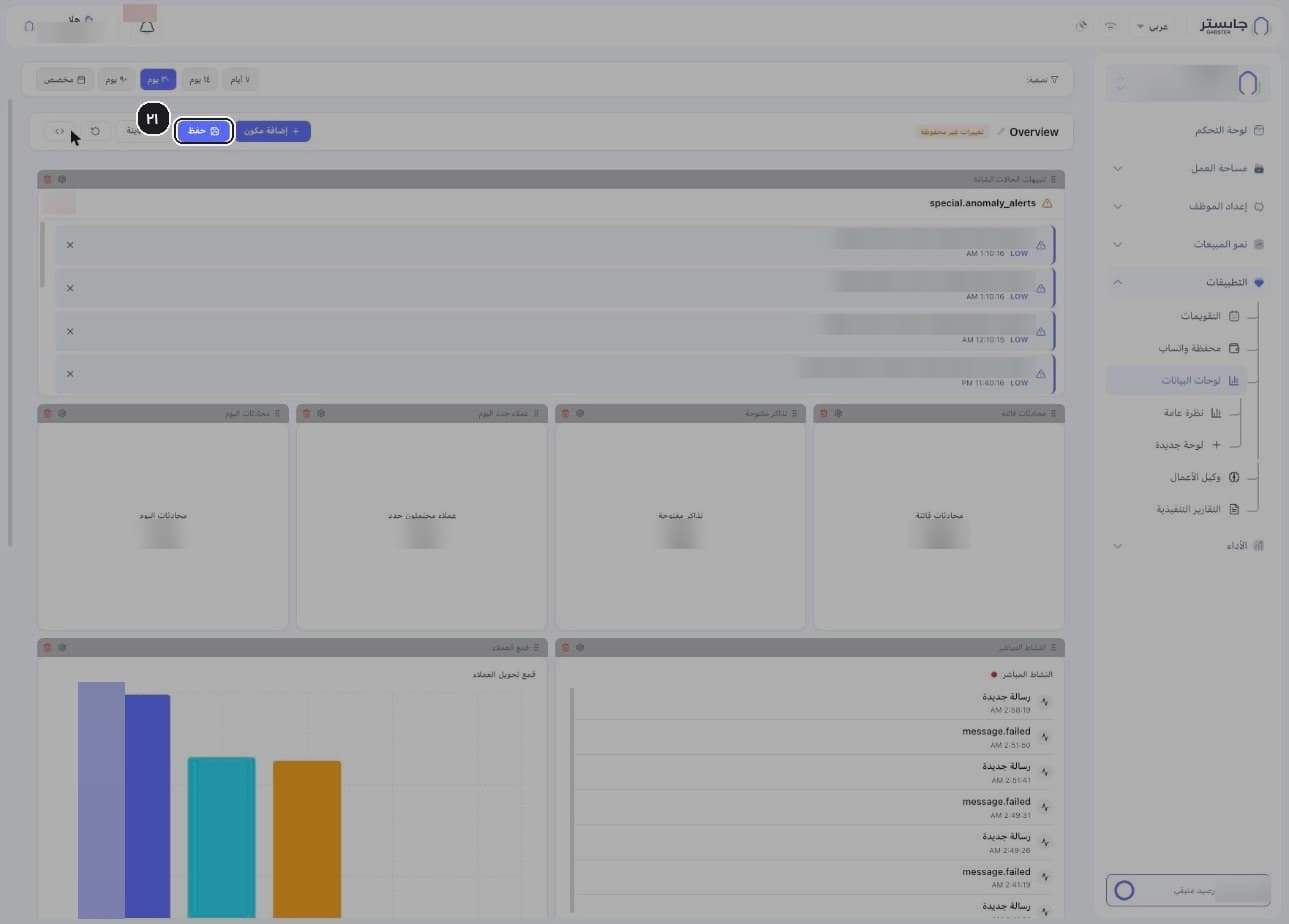
Read the widgets: anomaly alerts, the KPI cards (Missed conversations (محادثات فائتة), Open tickets (تذاكر مفتوحة), New leads (عملاء محتملون جدد), Today's conversations (محادثات اليوم)), the Customer conversion funnel (قمع تحويل العملاء), Live activity (النشاط المباشر) and Daily volume (الحجم اليومي).
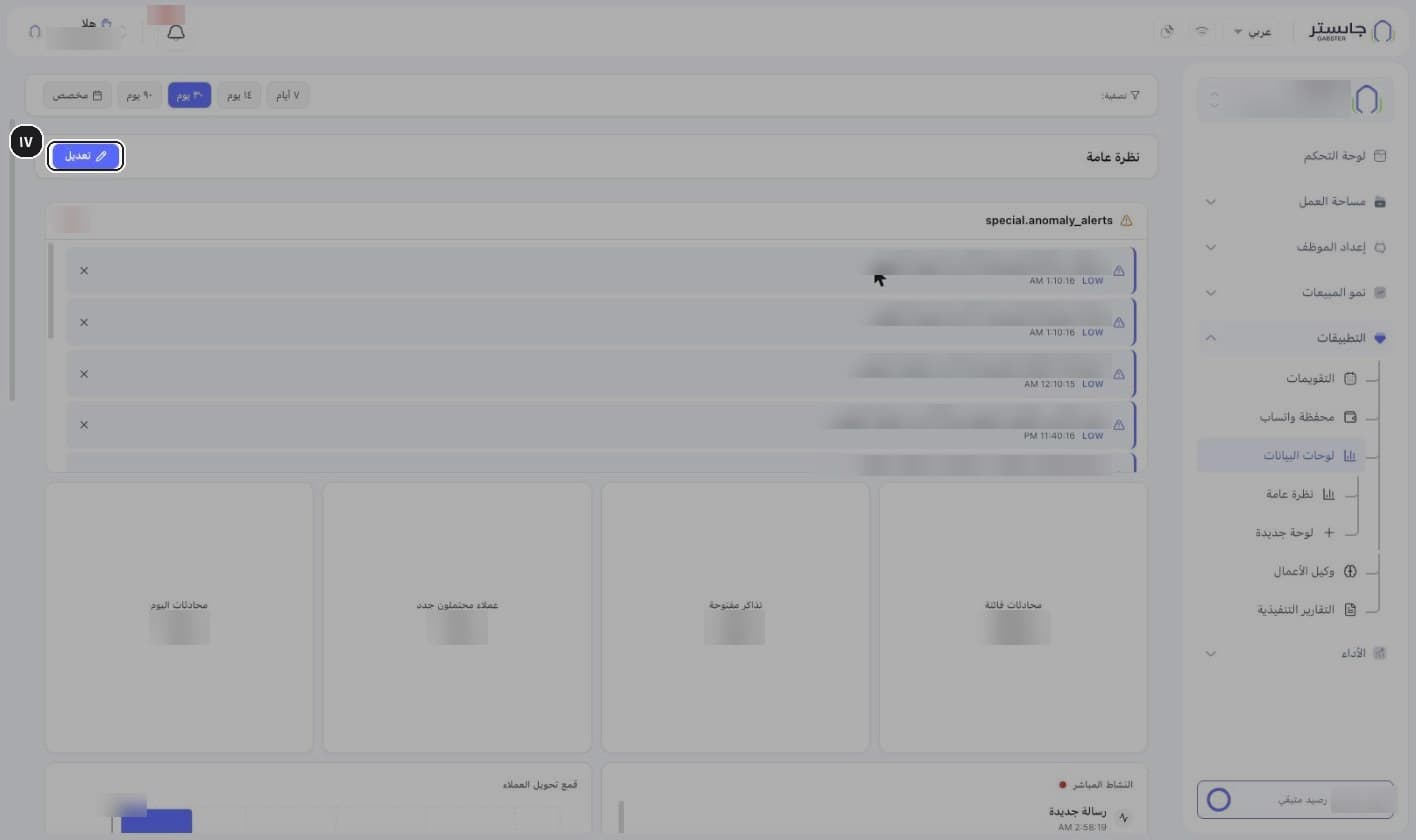
Click Edit (تعديل).
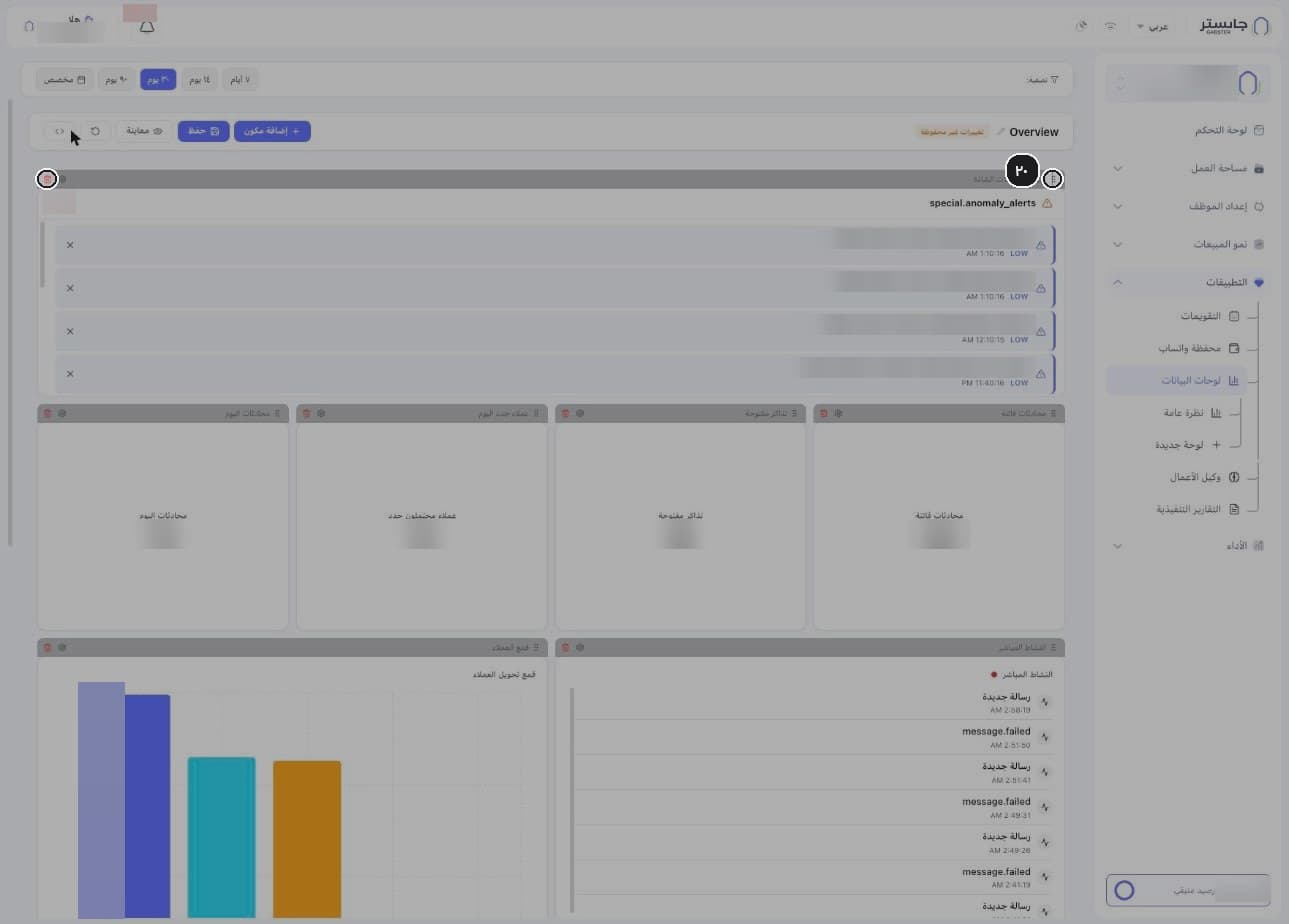
The dashboard switches to edit mode: each widget gets a bar with a drag handle, a settings icon and a delete icon, and an Unsaved changes (تغييرات غير محفوظة) badge appears.
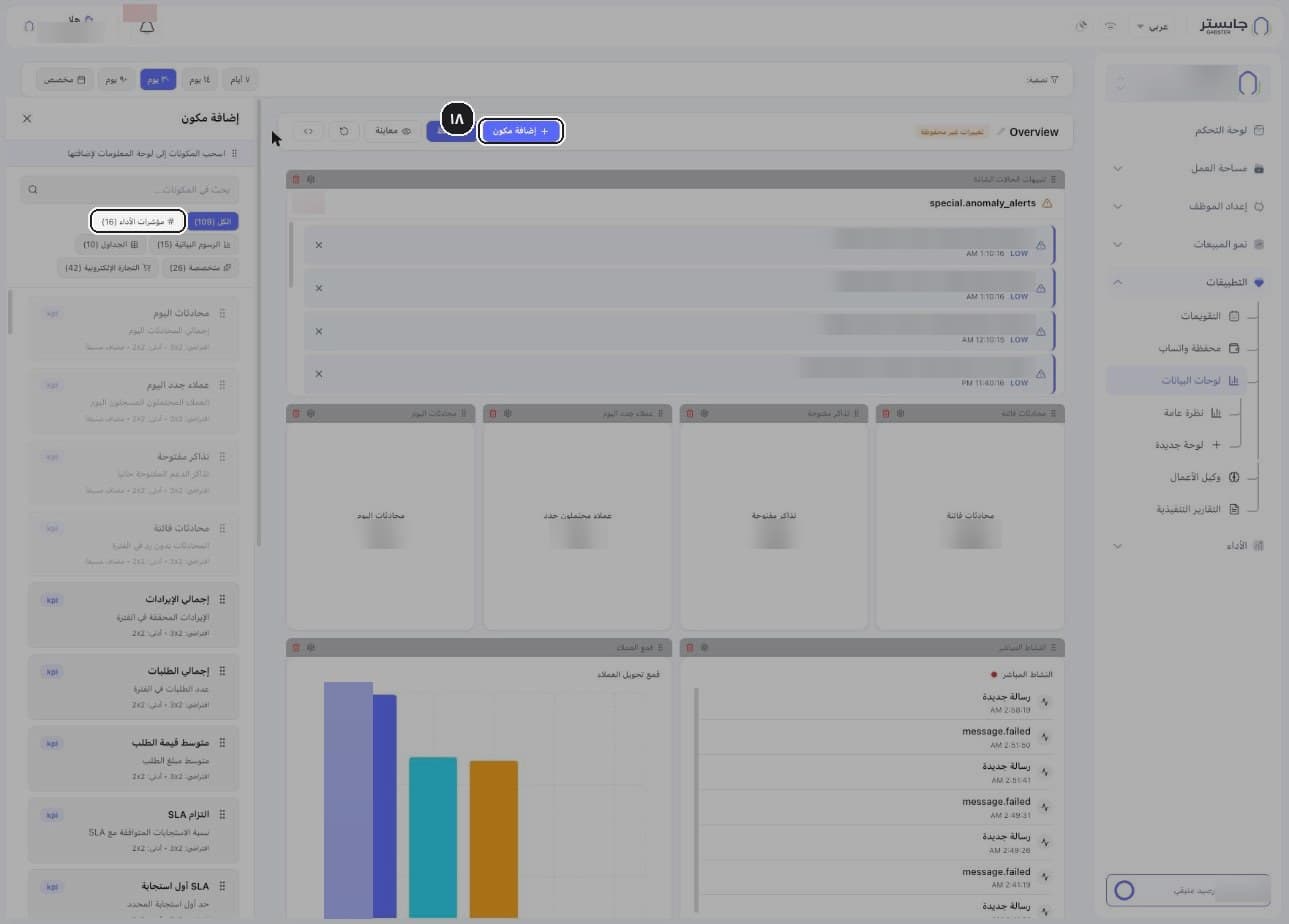
Click Add component (إضافة مكون) and pick a category.
A side panel opens with 109 components in KPIs (مؤشرات الأداء), Charts (الرسوم البيانية), Tables (الجداول), Specialized (متخصصة) and E-commerce (التجارة الإلكترونية). Components already on the dashboard are greyed out and marked Already added (مضاف مسبقًا).
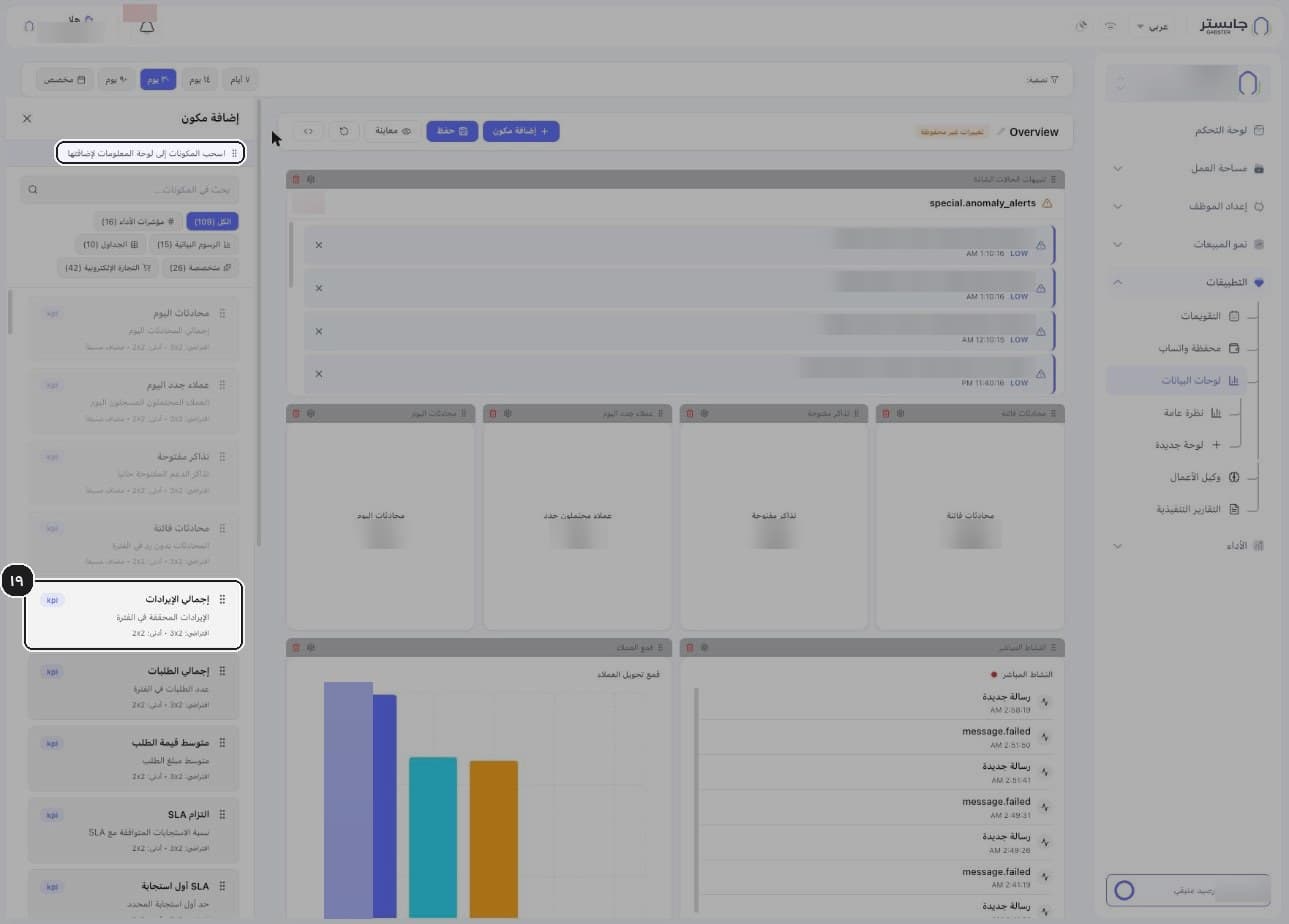
Drag a component onto the dashboard, as the hint "Drag components onto the dashboard to add them" (اسحب المكونات إلى لوحة المعلومات لإضافتها) says. Each component shows its default and minimum grid size.
Rearrange widgets with the drag handle, or remove one with the trash icon.
Click Save (حفظ).
C. Executive Reports
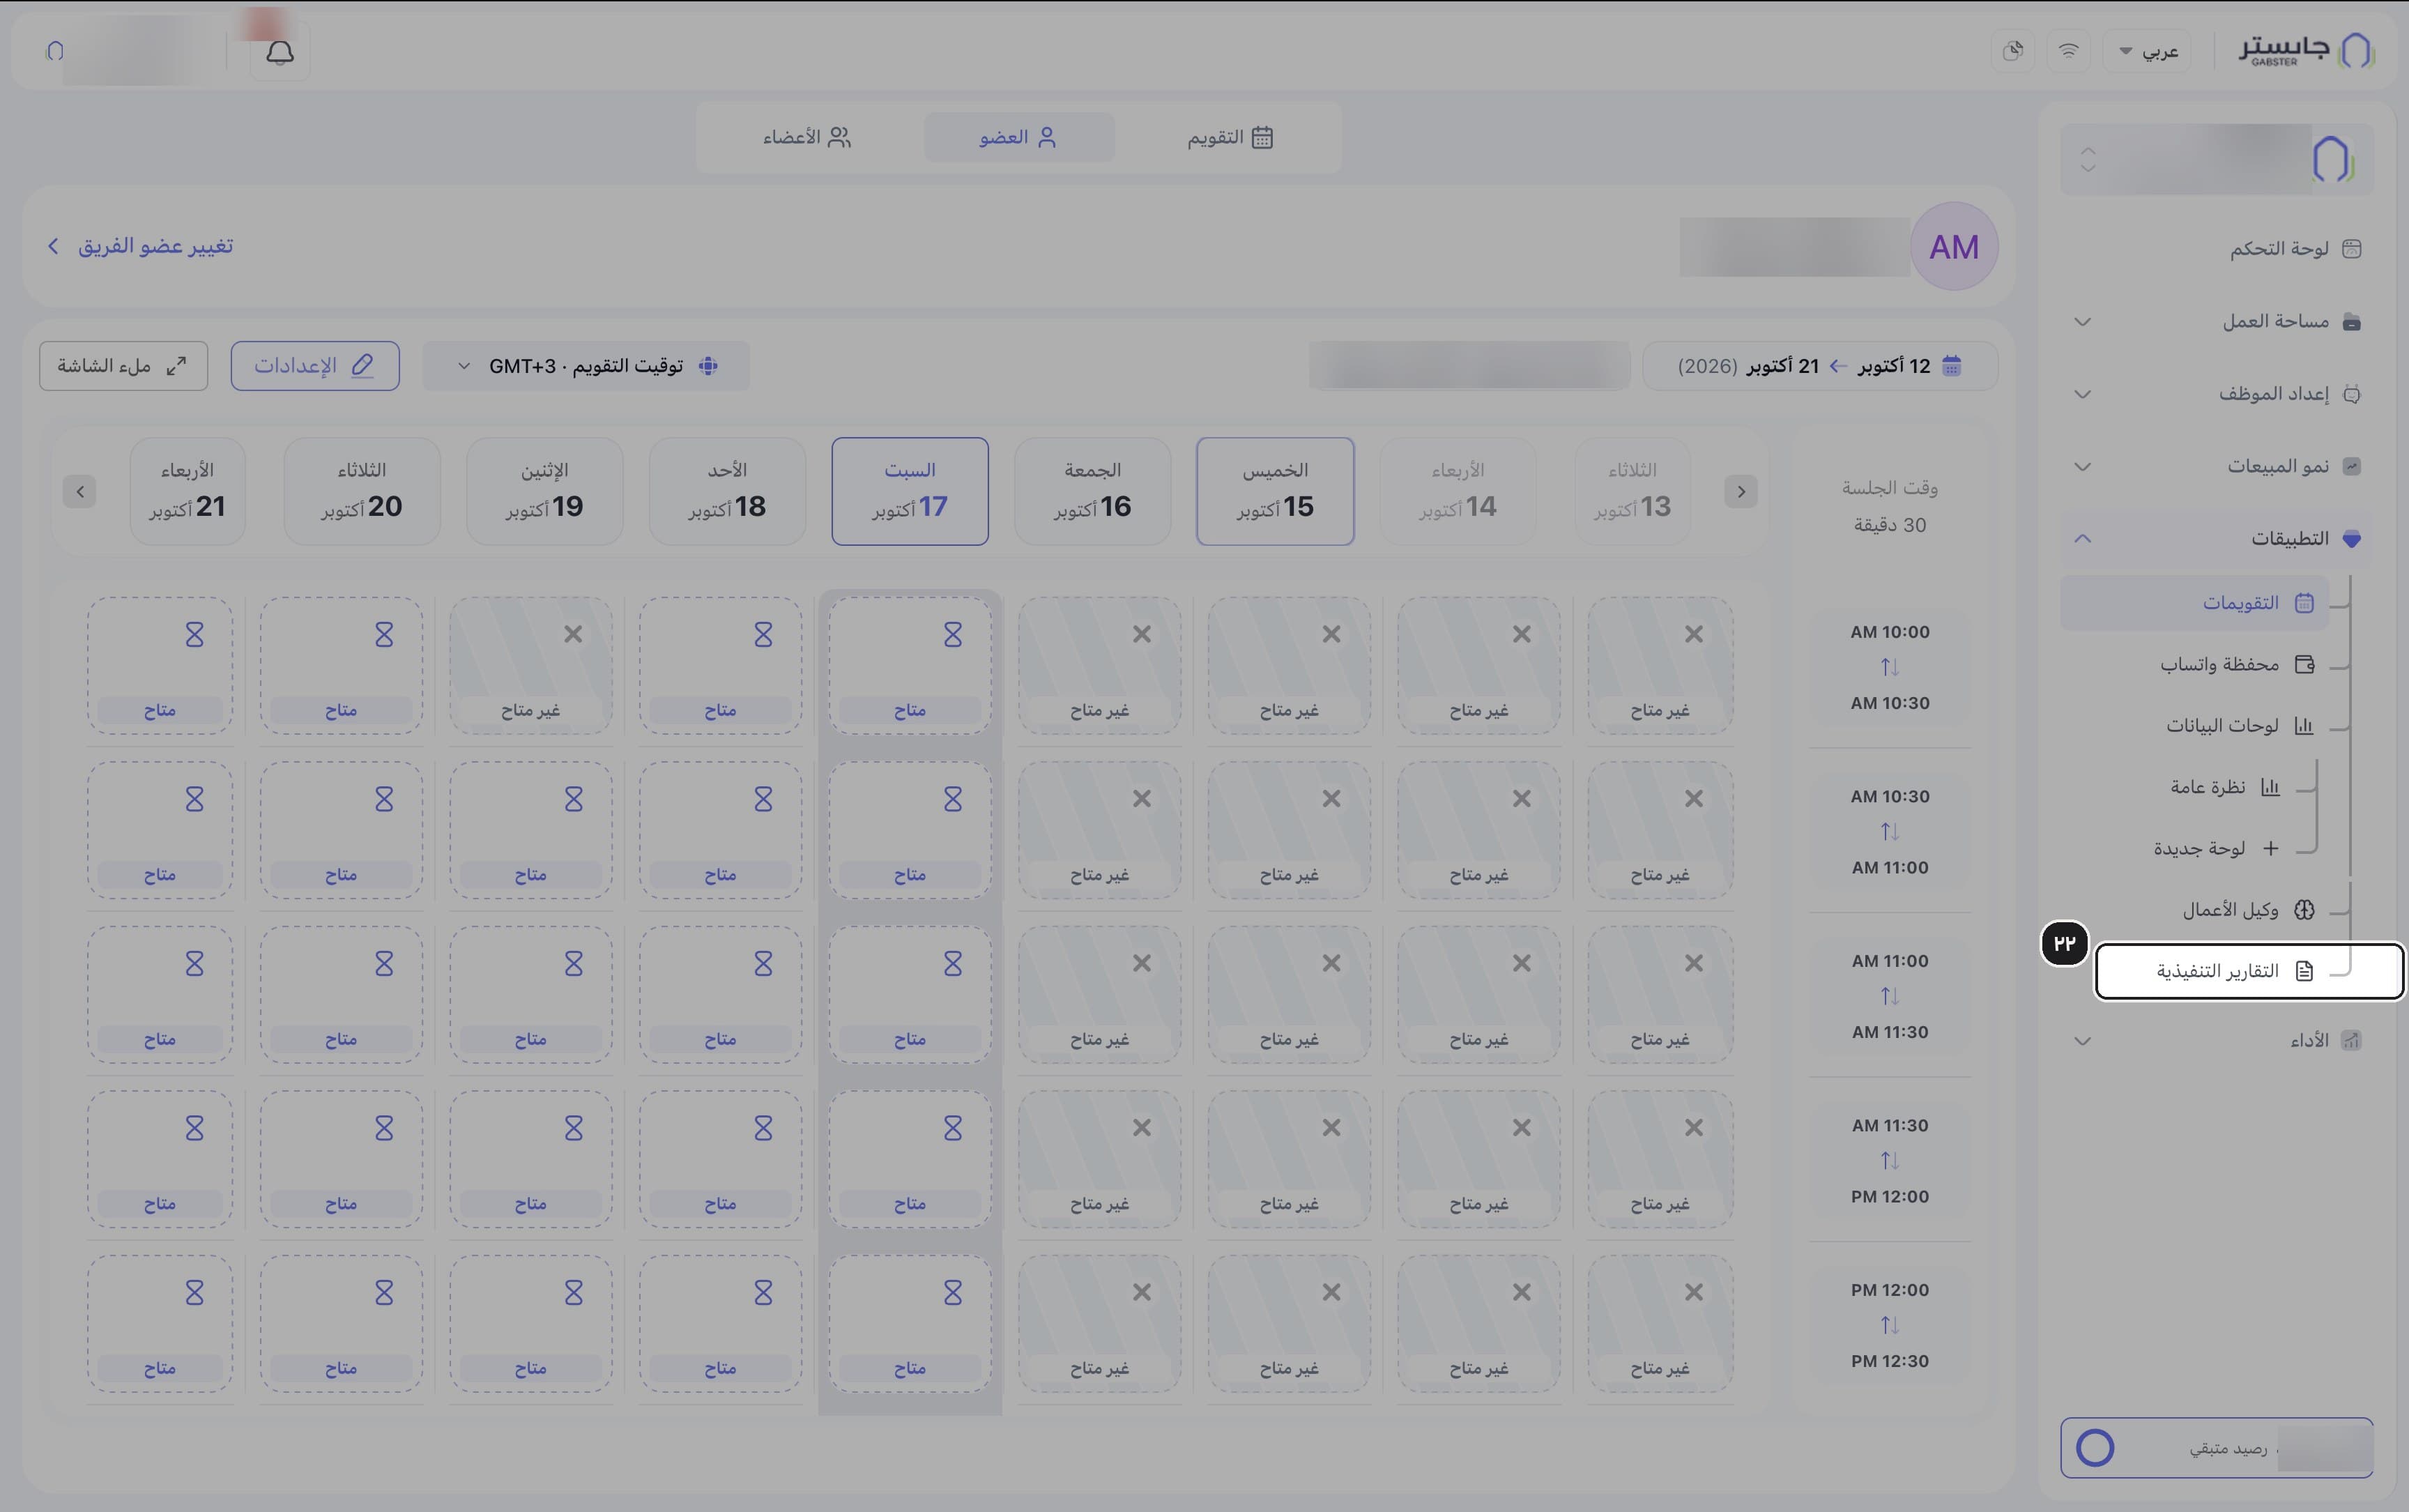
In the sidebar, open Apps → Executive Reports (التقارير التنفيذية).
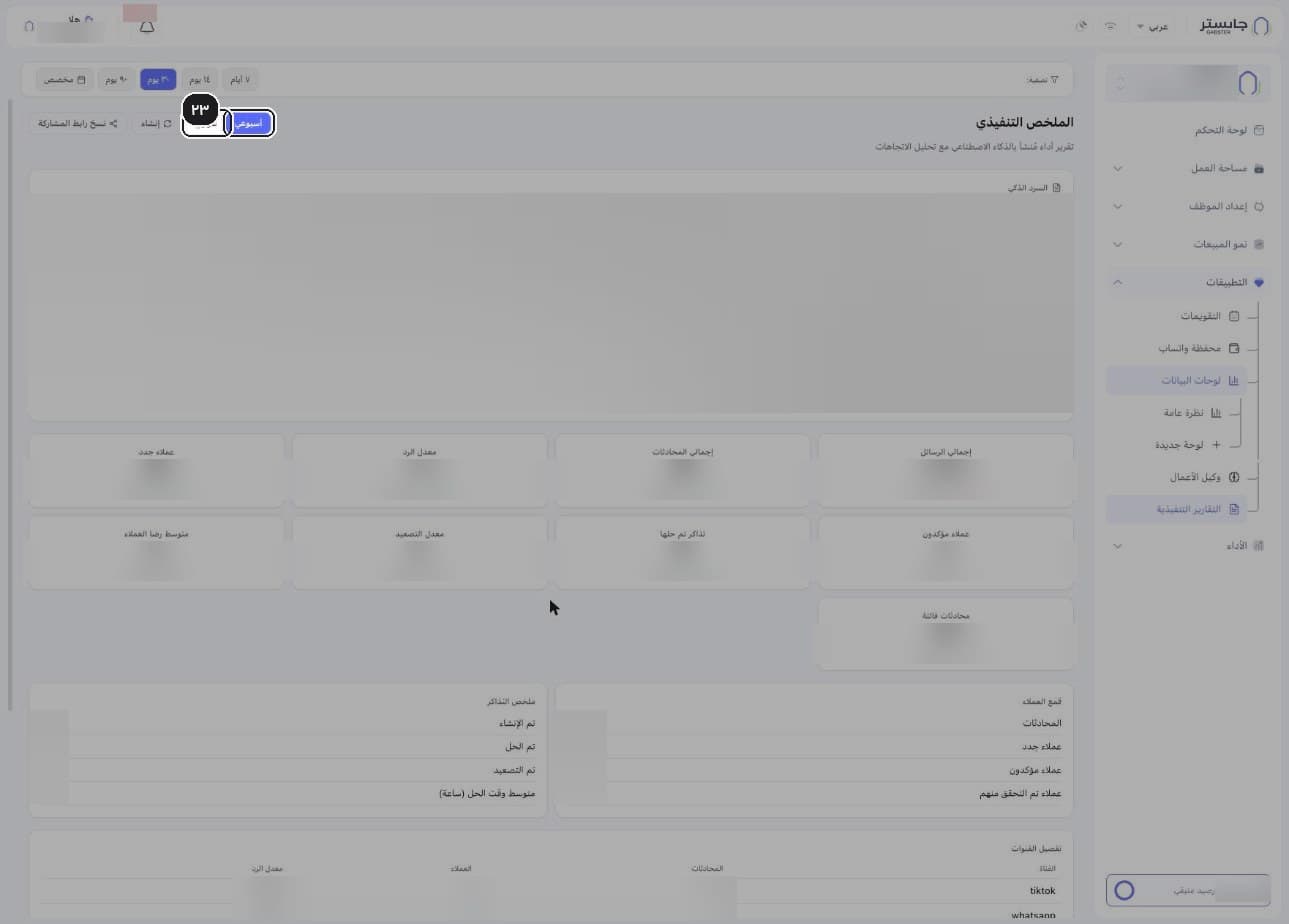
The Executive Summary (الملخص التنفيذي) page opens: an AI-generated performance report.
Choose Weekly (أسبوعي) or Monthly (شهري).
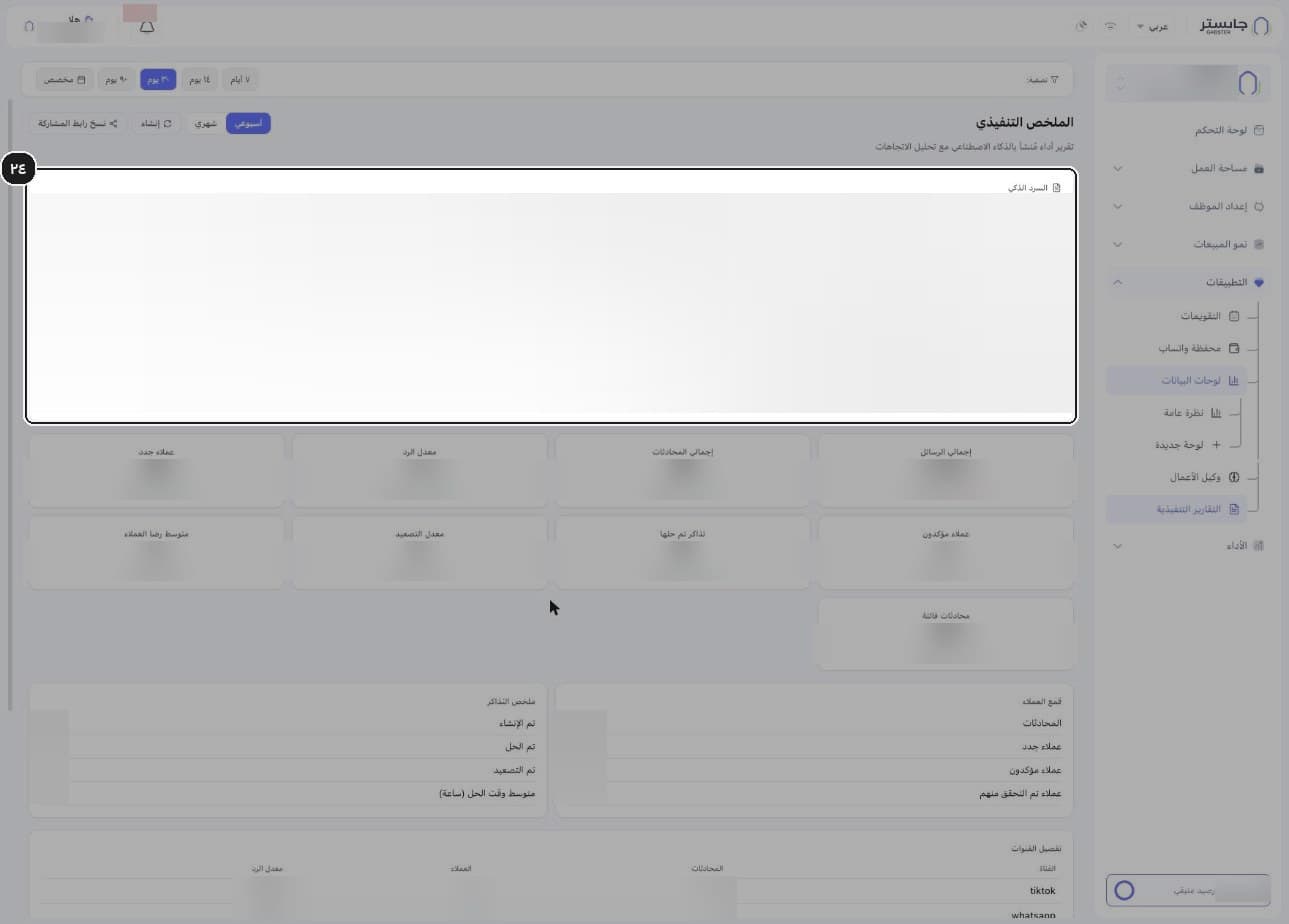
Read the AI narrative (السرد الذكي): a write-up of the period that ends with numbered recommendations. The same recommendations appear in the Recommendations (التوصيات) card.
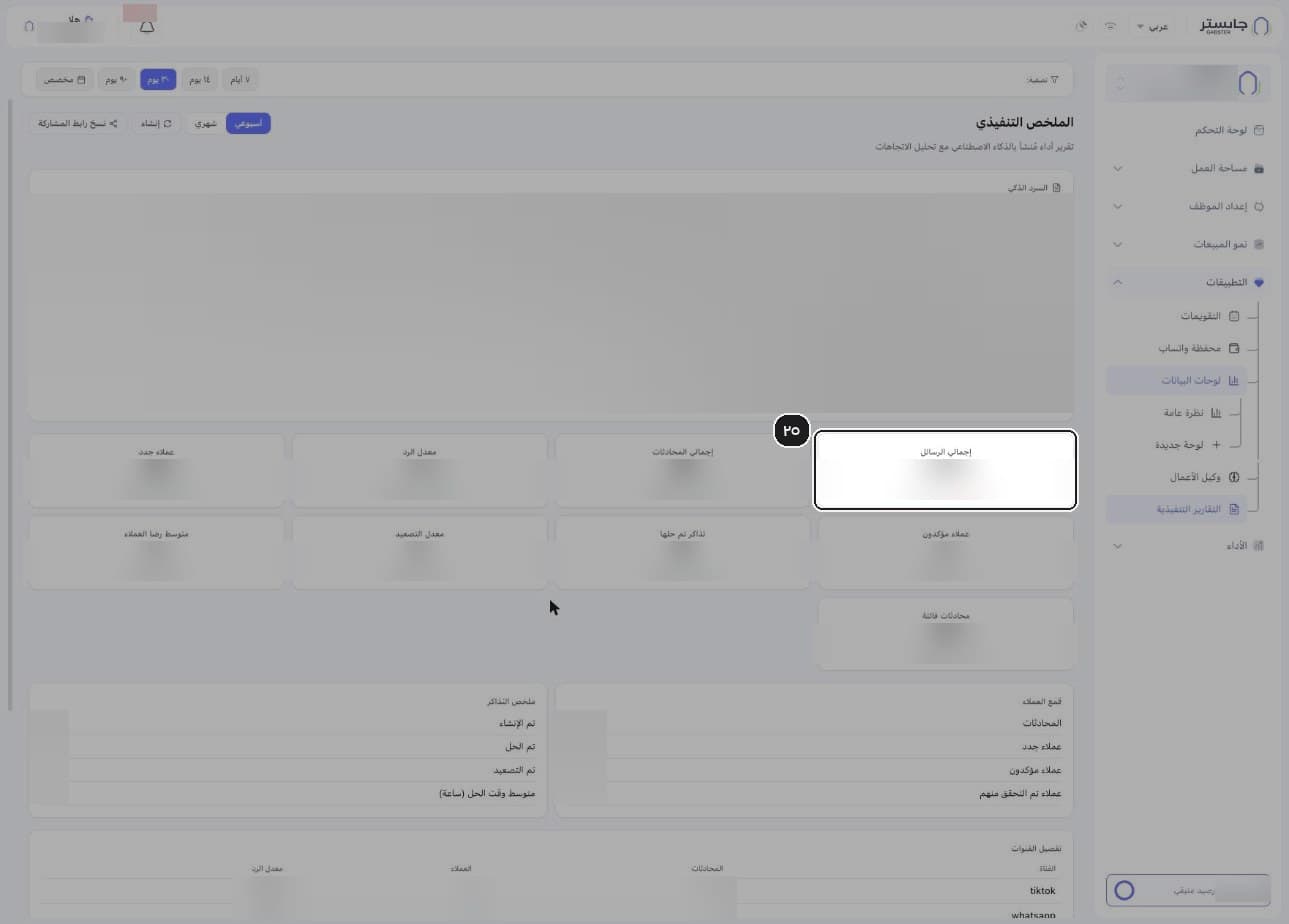
Read the KPI cards. Each card shows the value, its trend and the percentage change against the previous period's value.
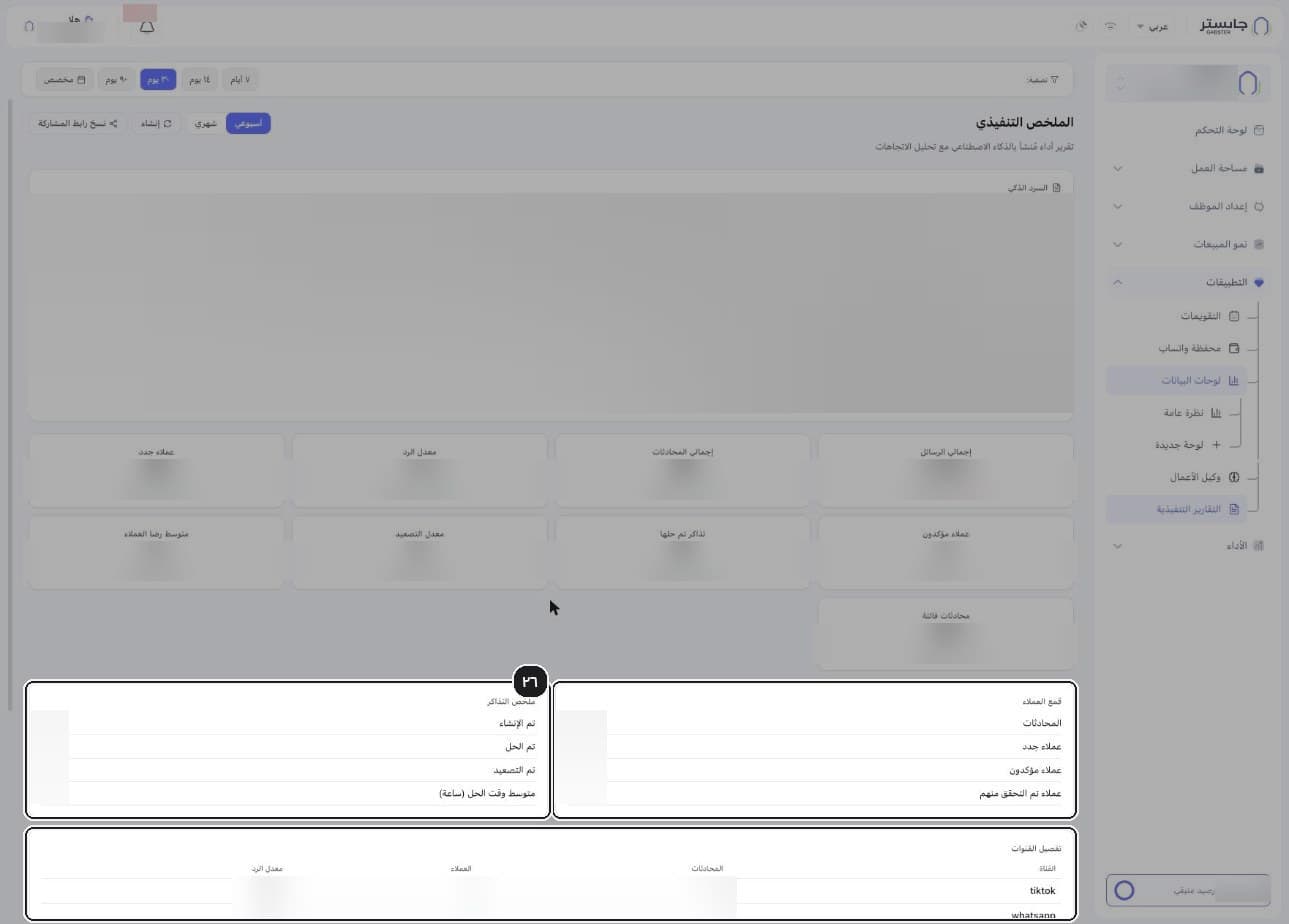
Read the Customer funnel (قمع العملاء), Ticket summary (ملخص التذاكر) and Channel breakdown (تفصيل القنوات) — conversations, customers and response rate per channel.
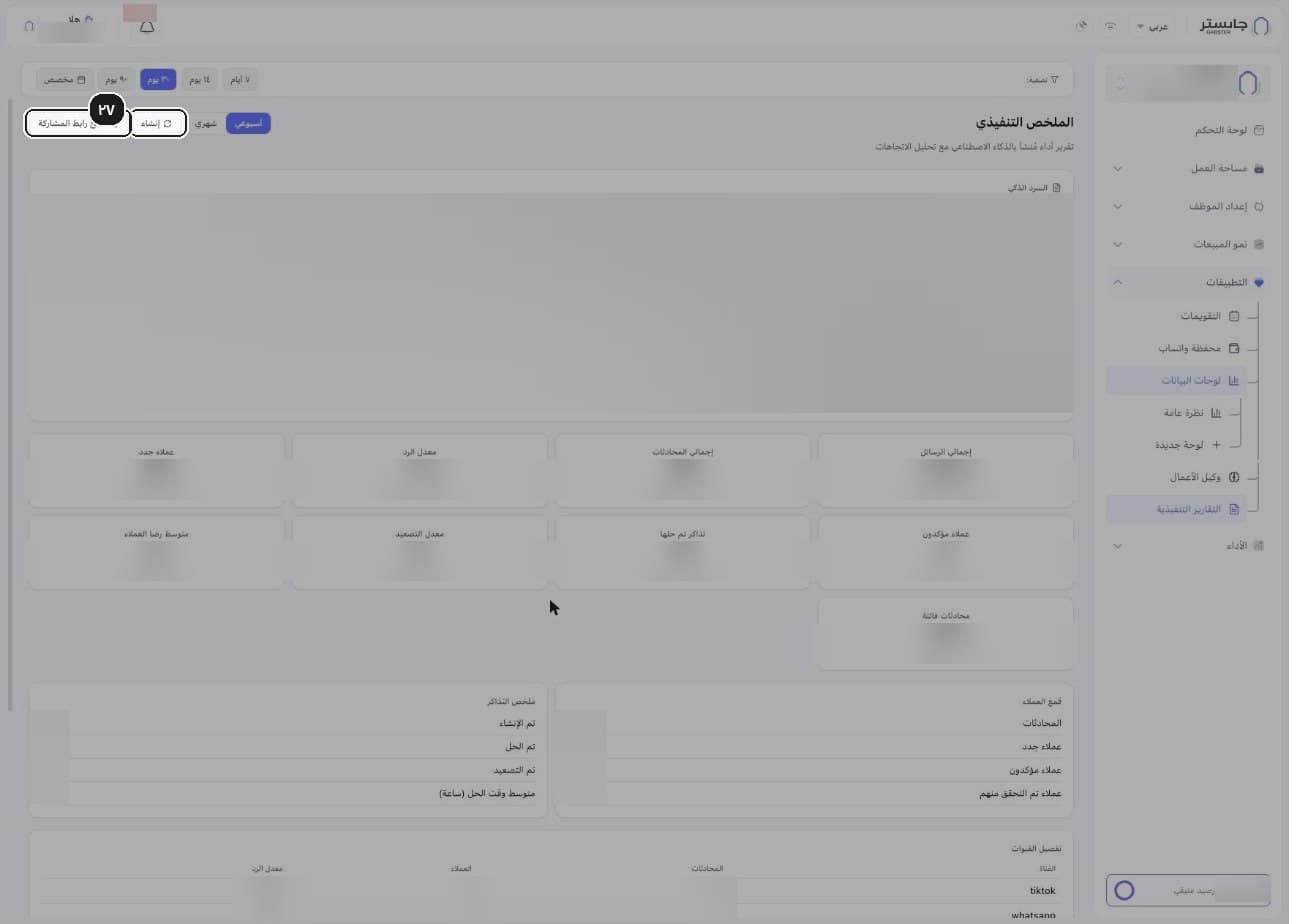
Click Generate (إنشاء) to regenerate the report, or Copy share link (نسخ رابط المشاركة) to share it.
D. Business Agent
In the sidebar, open Apps → Business Agent (وكيل الأعمال).
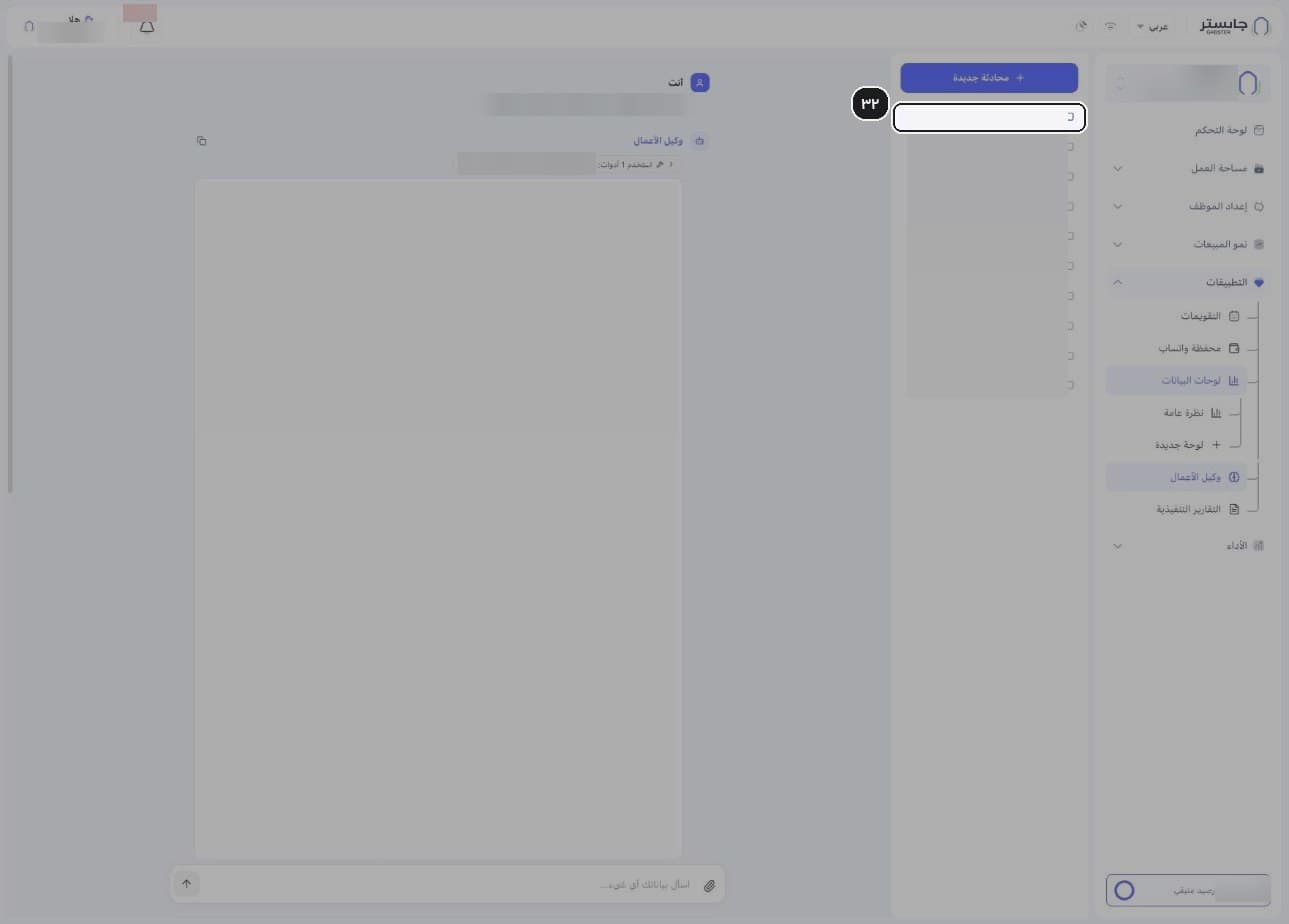
A conversation about your account's data appears, with past conversations on the right.
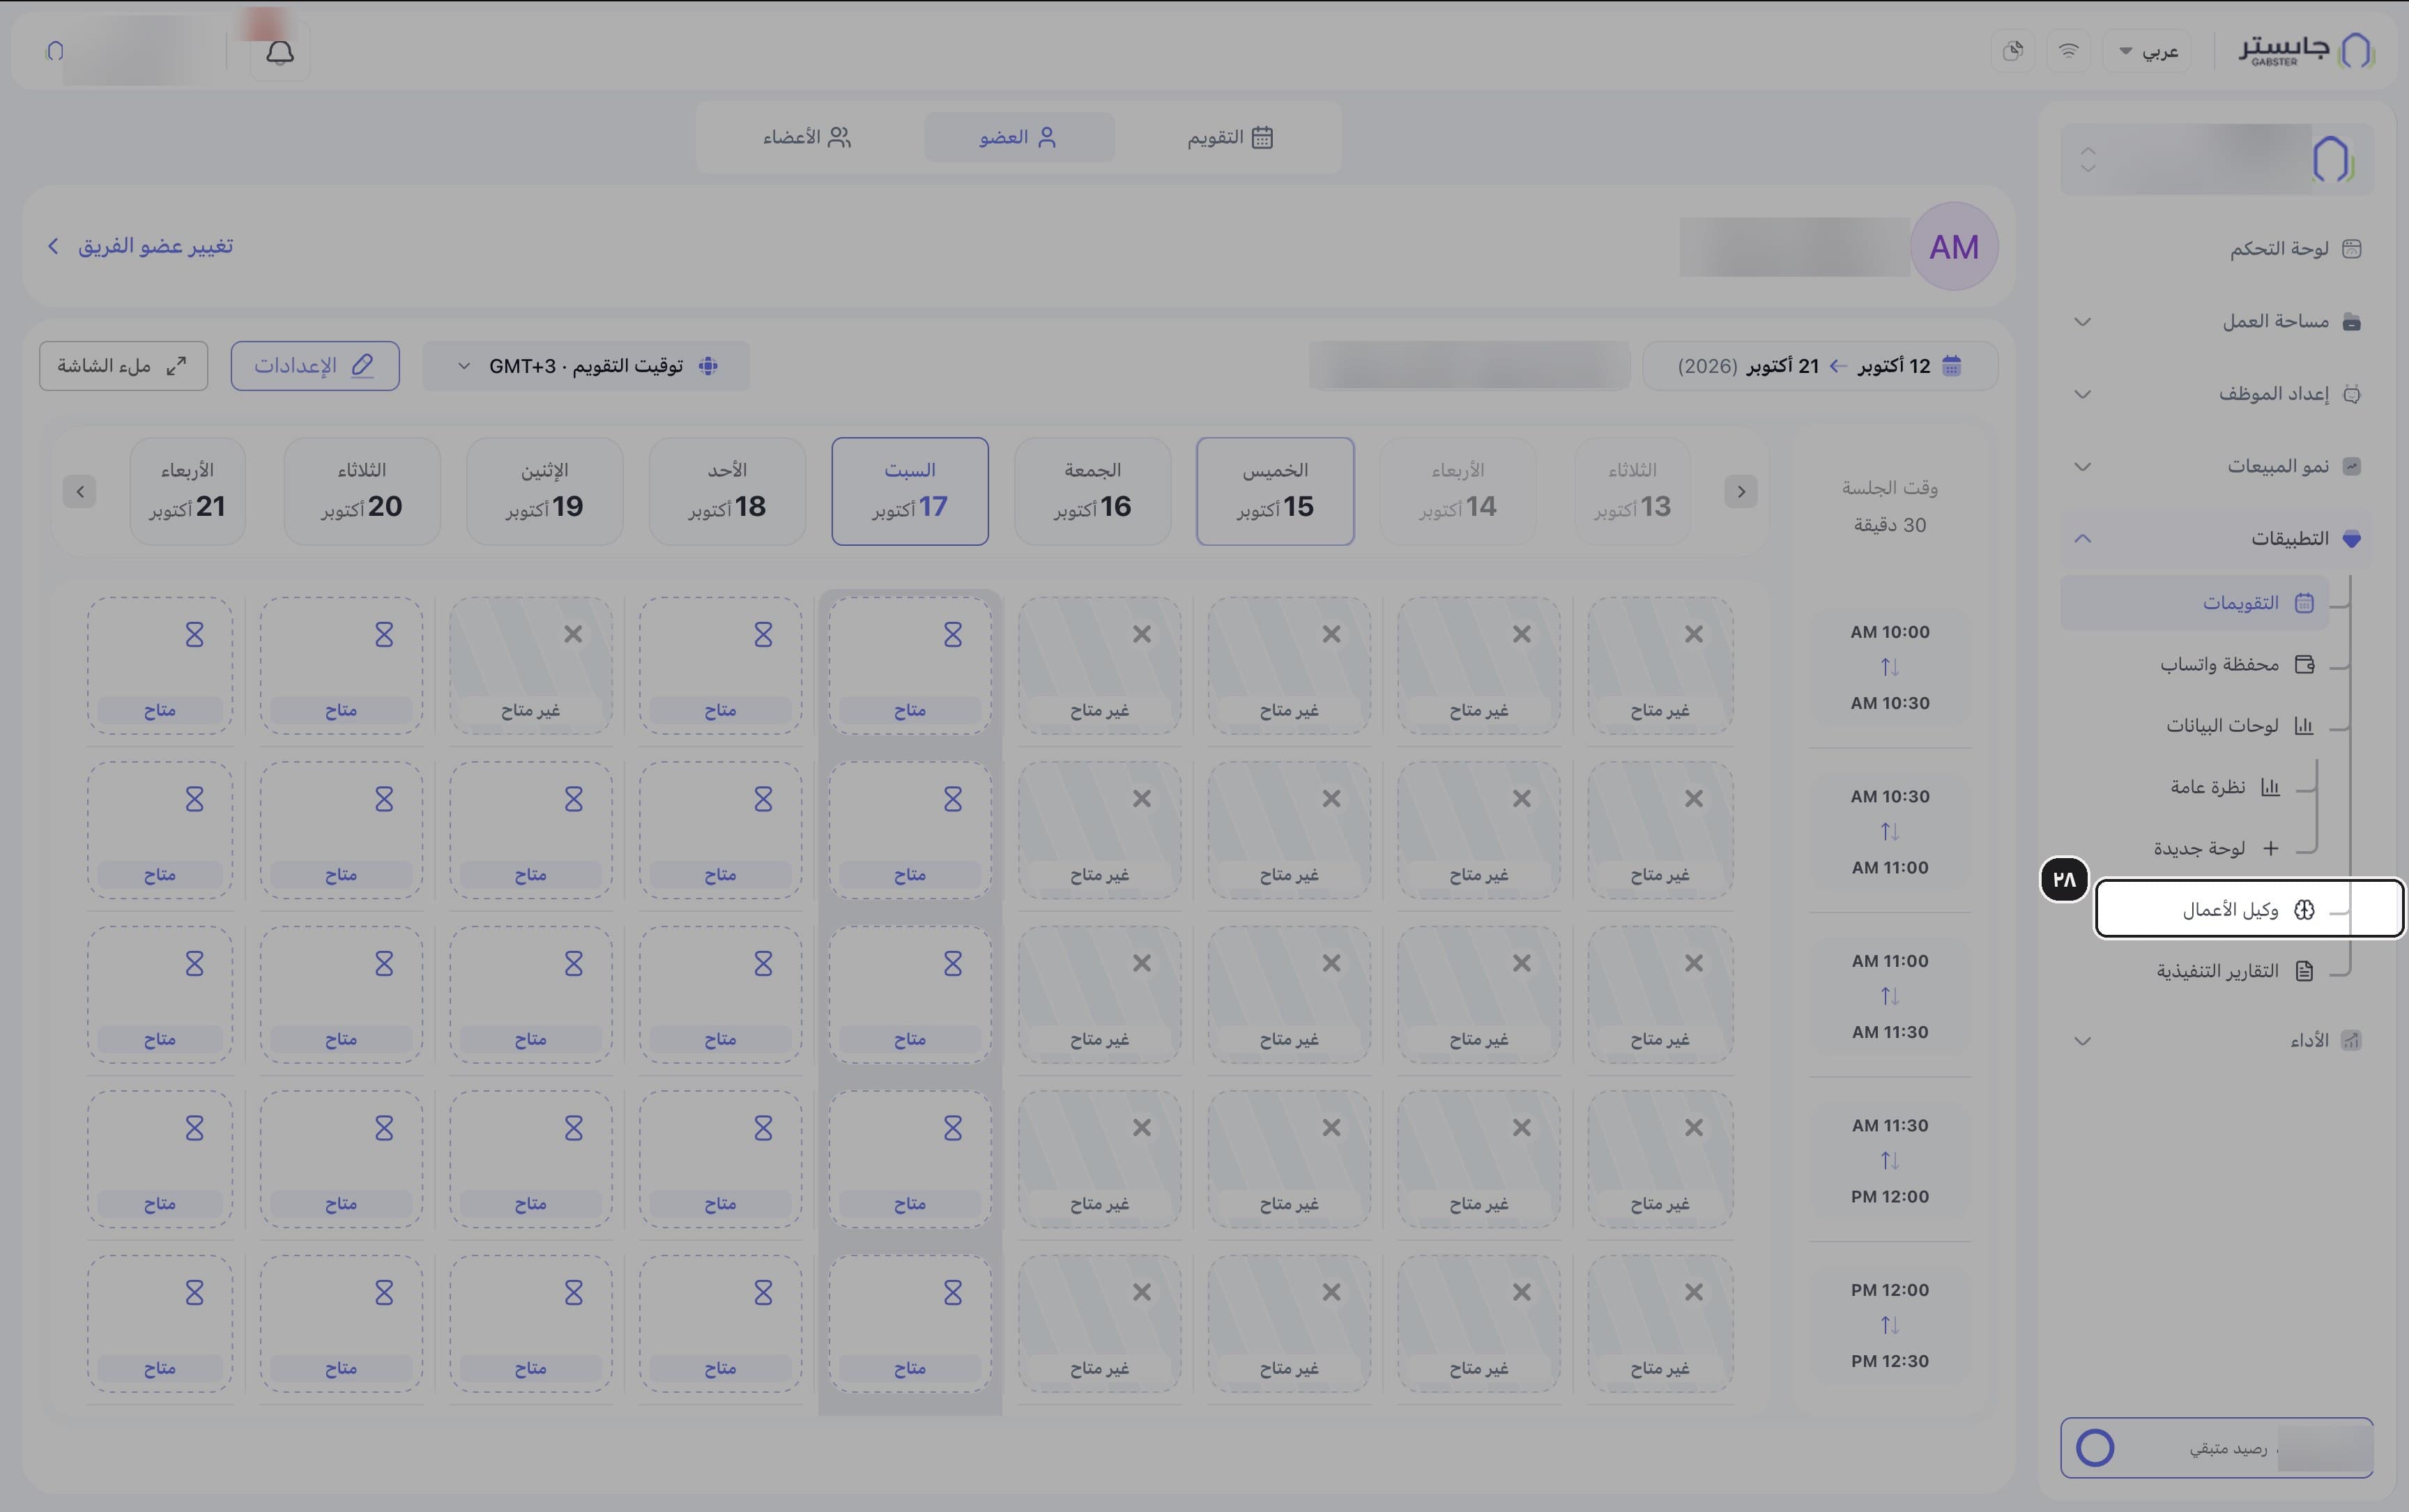
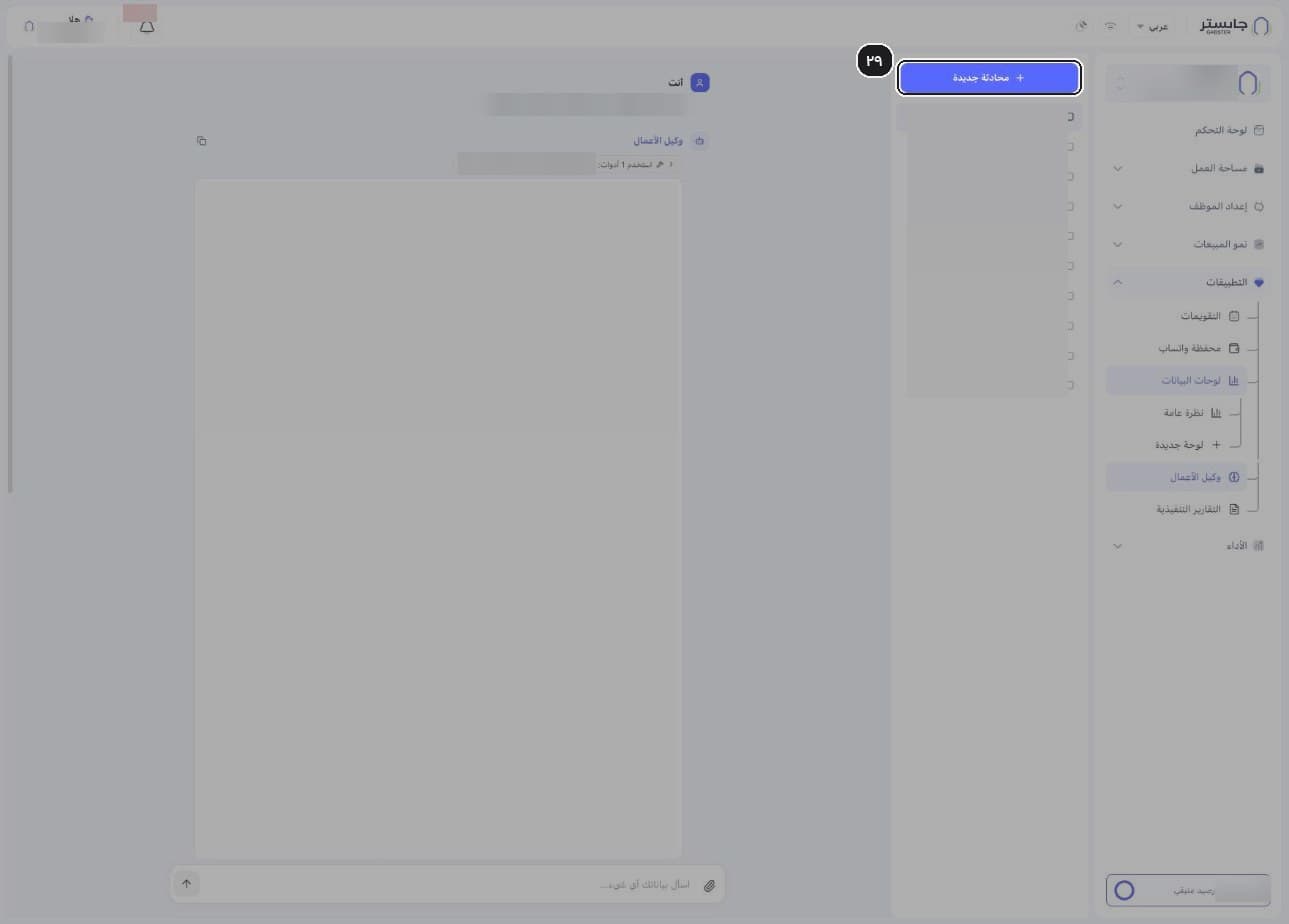
Click New conversation (محادثة جديدة).
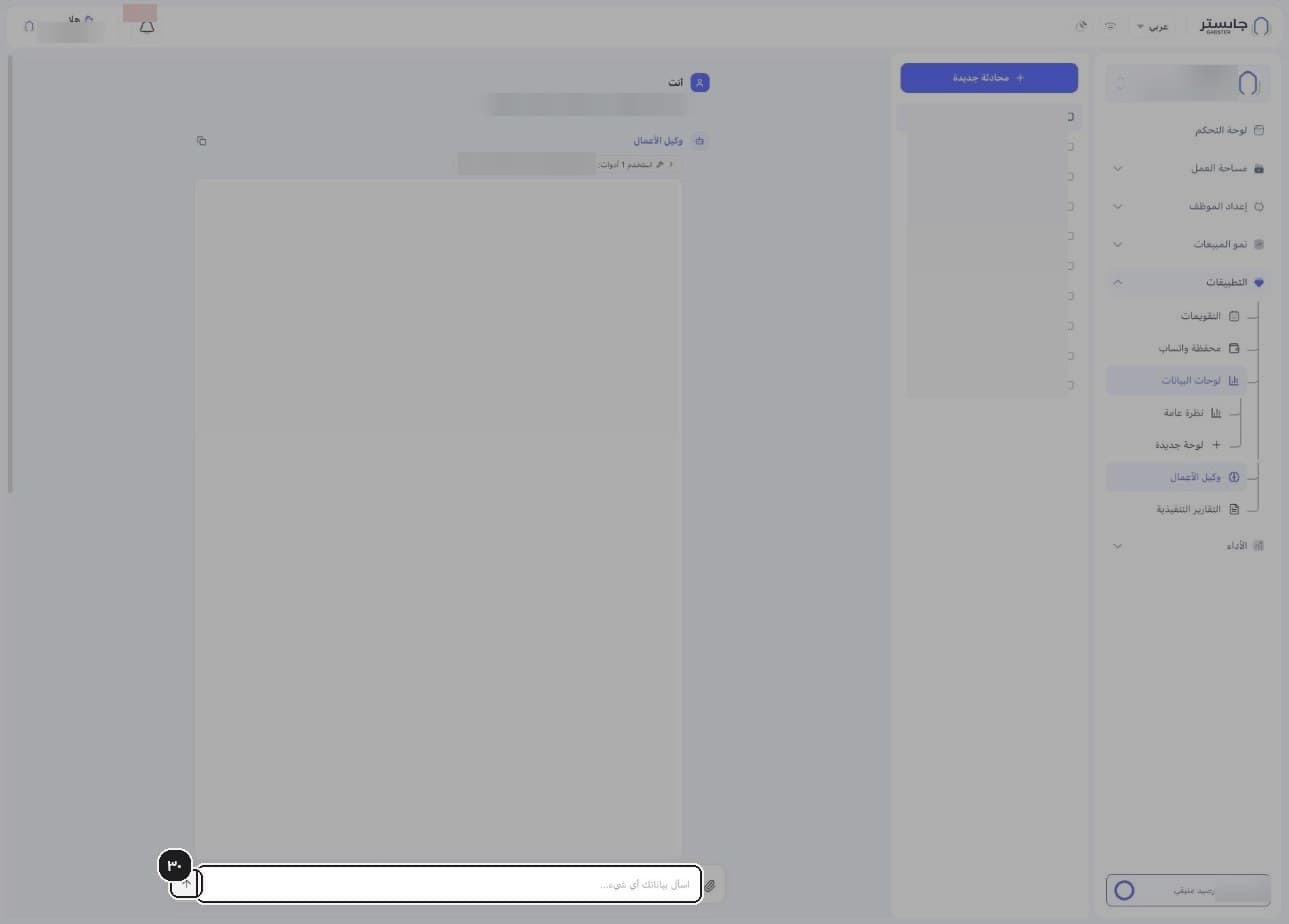
Type your question in plain language in Ask your data anything… (اسأل بياناتك أي شيء...) and send it with the arrow button.
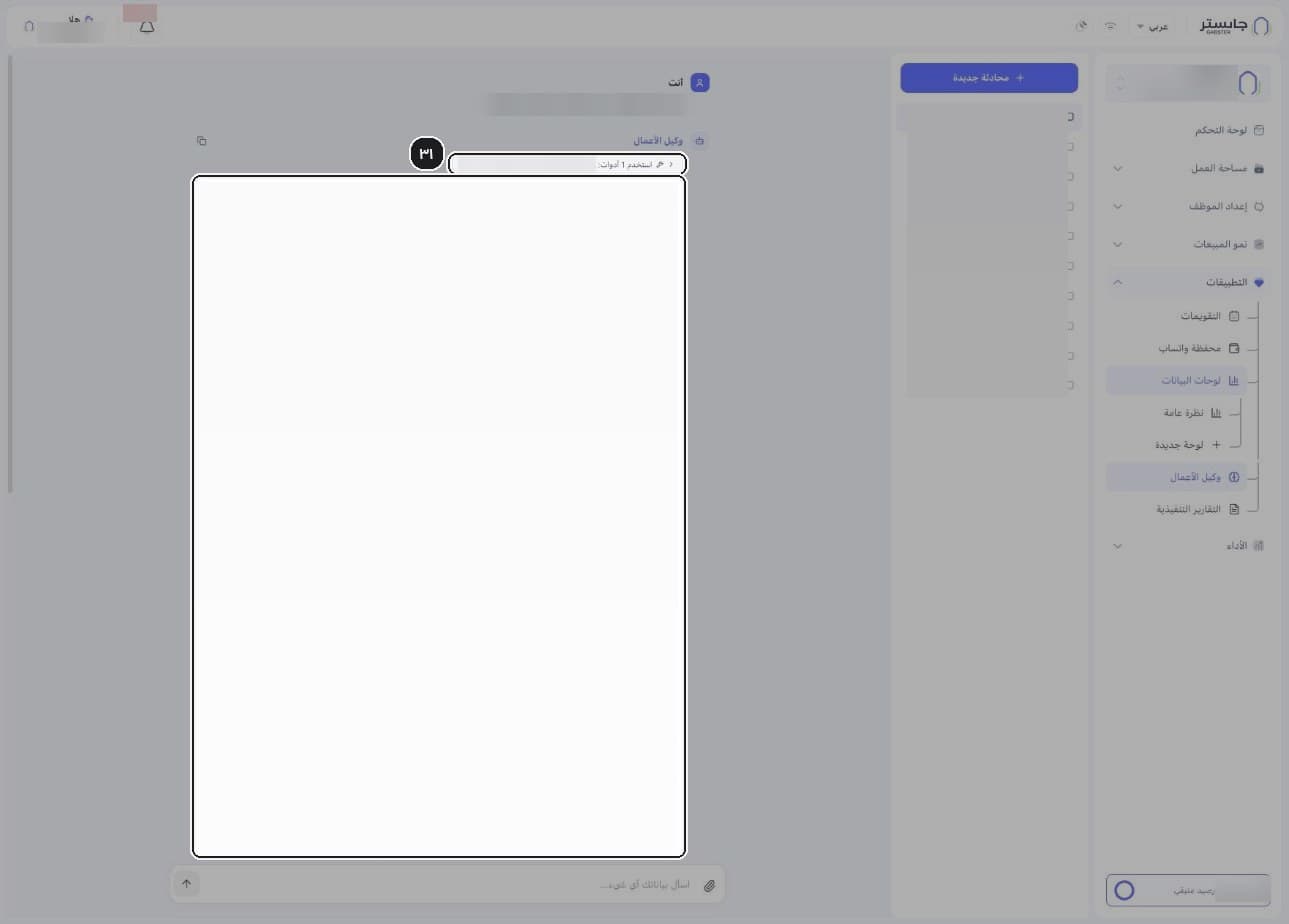
Read the answer. A chip above the reply shows how many tools the Business Agent used, followed by the reply card with text and tables.
To reopen an earlier conversation, choose it from the list.
Related
Top up the WhatsApp Wallet and track your balance
Read your WhatsApp Wallet balance, free replies and transactions, and start a top-up before the balance runs out.
Hand conversations to your team and create functions
Decide when your AI Agent hands a conversation to your team, and create functions that collect customer data and open a ticket.