
Apps
Data Dashboards
See your project's metrics on ready-made dashboards or on dashboards you build from drag-and-drop components.
Data Dashboards (لوحات البيانات) bring your project's numbers together: conversations, tickets, customers, live activity and more. The page lists ready-made default dashboards and your own dashboards, and in edit mode you add components to a dashboard from a component catalog.
How to open it
In the sidebar, open Apps (التطبيقات), then Data Dashboards (لوحات البيانات), and choose:
- Overview (نظرة عامة): the list of all your dashboards.
- New dashboard (لوحة جديدة): start a new dashboard.
Filter bar
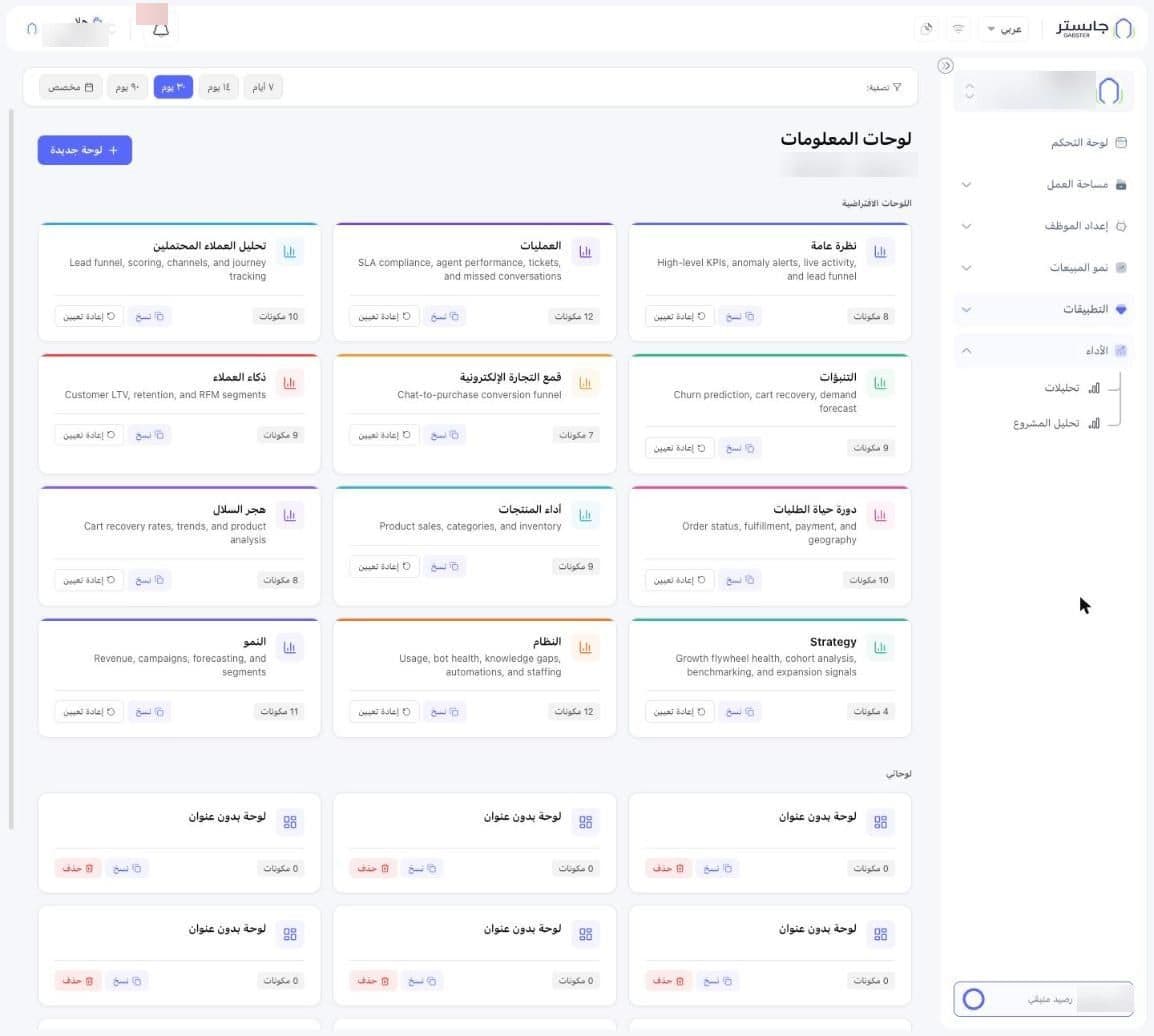
The Filter (تصفية:) bar stays pinned at the top of the page as you scroll. It holds the period chips 7 days (٧ أيام), 14 days (١٤ يوم), 30 days (٣٠ يوم), 90 days (٩٠ يوم) and Custom (مخصص, with a calendar icon). 30 days is selected by default.
Dashboard list
The page title reads Data Dashboards (لوحات المعلومات). Below it is the number of dashboards and groups, and next to it a New dashboard (لوحة جديدة) button.
Default dashboards
Ready-made dashboards provided by Gabster, each with a short description and its number of components (e.g. 8 components (8 مكونات)). There are twelve: Overview (نظرة عامة), Operations (العمليات), Lead Analysis (تحليل العملاء المحتملين), Forecasts (التنبؤات), E-commerce Funnel (قمع التجارة الإلكترونية), Customer Intelligence (ذكاء العملاء), Order Lifecycle (دورة حياة الطلبات), Product Performance (أداء المنتجات), Cart Abandonment (هجر السلال), Strategy, System (النظام) and Growth (النمو).
Each card has two buttons:
- Copy (نسخ): make a copy of the dashboard.
- Reset (إعادة تعيين): return the dashboard to its default state.
My dashboards
My dashboards (لوحاتي) holds your account's own dashboards. Each card shows its number of components and has Copy (نسخ) and Delete (حذف) buttons.
Dashboard groups
A group combines several dashboards so they appear as tabs. Click New group (مجموعة جديدة) to create one. Until you do, the section shows No groups yet. Create one to combine dashboards as tabs. (لا توجد مجموعات بعد. أنشئ واحدة لدمج اللوحات كتبويبات.)
View a dashboard
When you open a dashboard, its name appears at the top with an Edit (تعديل) button next to it.
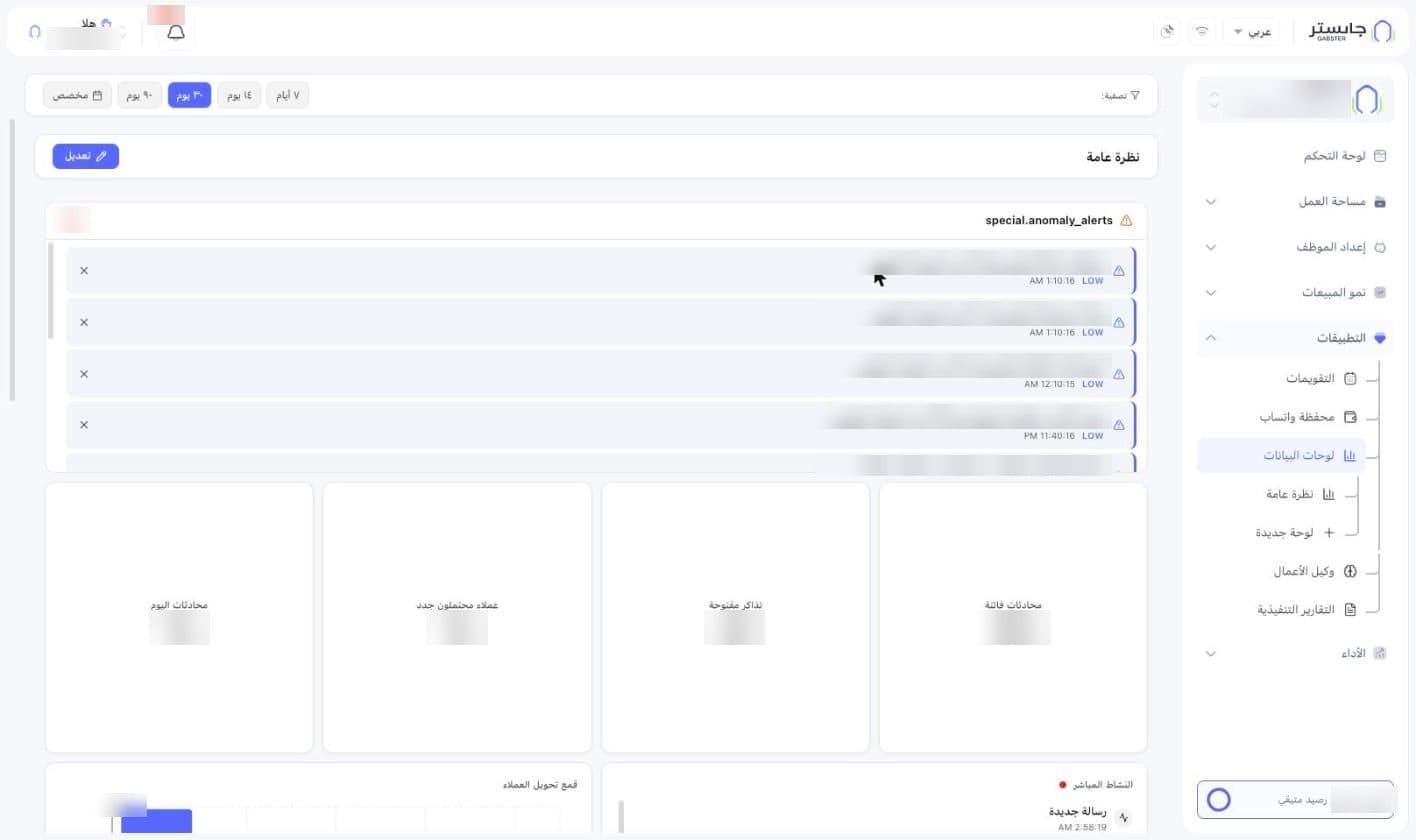
The default Overview (نظرة عامة) dashboard contains:
| Component | What it shows |
|---|---|
| Anomaly alerts (تنبيهات الحالات الشاذة) | Automatic alerts when a metric moves away from its normal rate, with the alert time and severity |
| Missed conversations (محادثات فائتة) | Number of missed conversations |
| Open tickets (تذاكر مفتوحة) | Number of open tickets |
| New leads (عملاء محتملون جدد) | Number of new leads |
| Today's conversations (محادثات اليوم) | Number of conversations today |
| Live activity (النشاط المباشر) | The latest events, such as New message (رسالة جديدة), newest first |
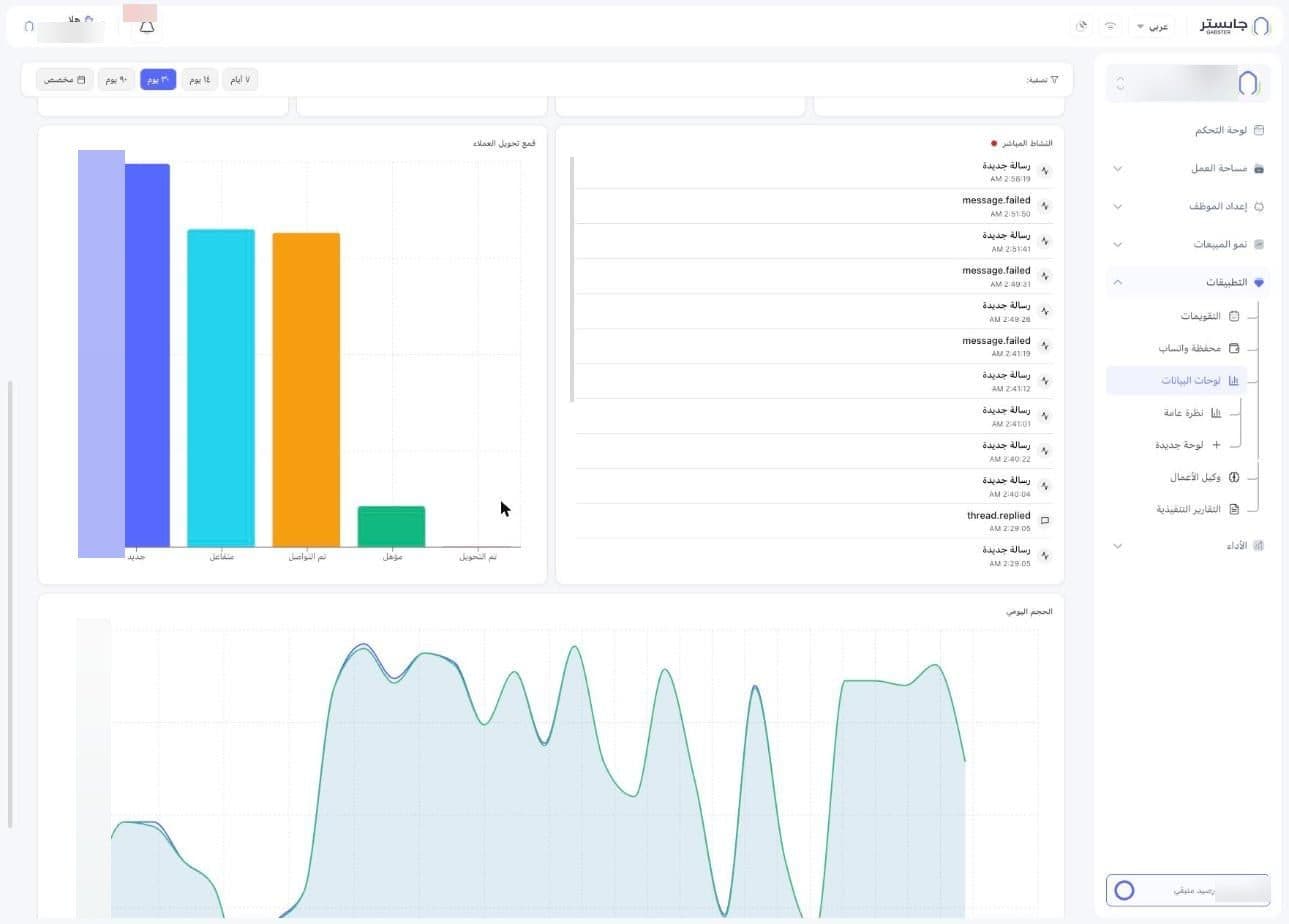
| Customer conversion funnel (قمع تحويل العملاء) | Customers at each stage: New (جديد), Engaged (متفاعل), Contacted (تم التواصل), Qualified (مؤهل), Converted (تم التحويل) |
| Daily volume (الحجم اليومي) | A daily curve of conversations, customers and tickets |
Each alert has an × at its edge.
Edit a dashboard
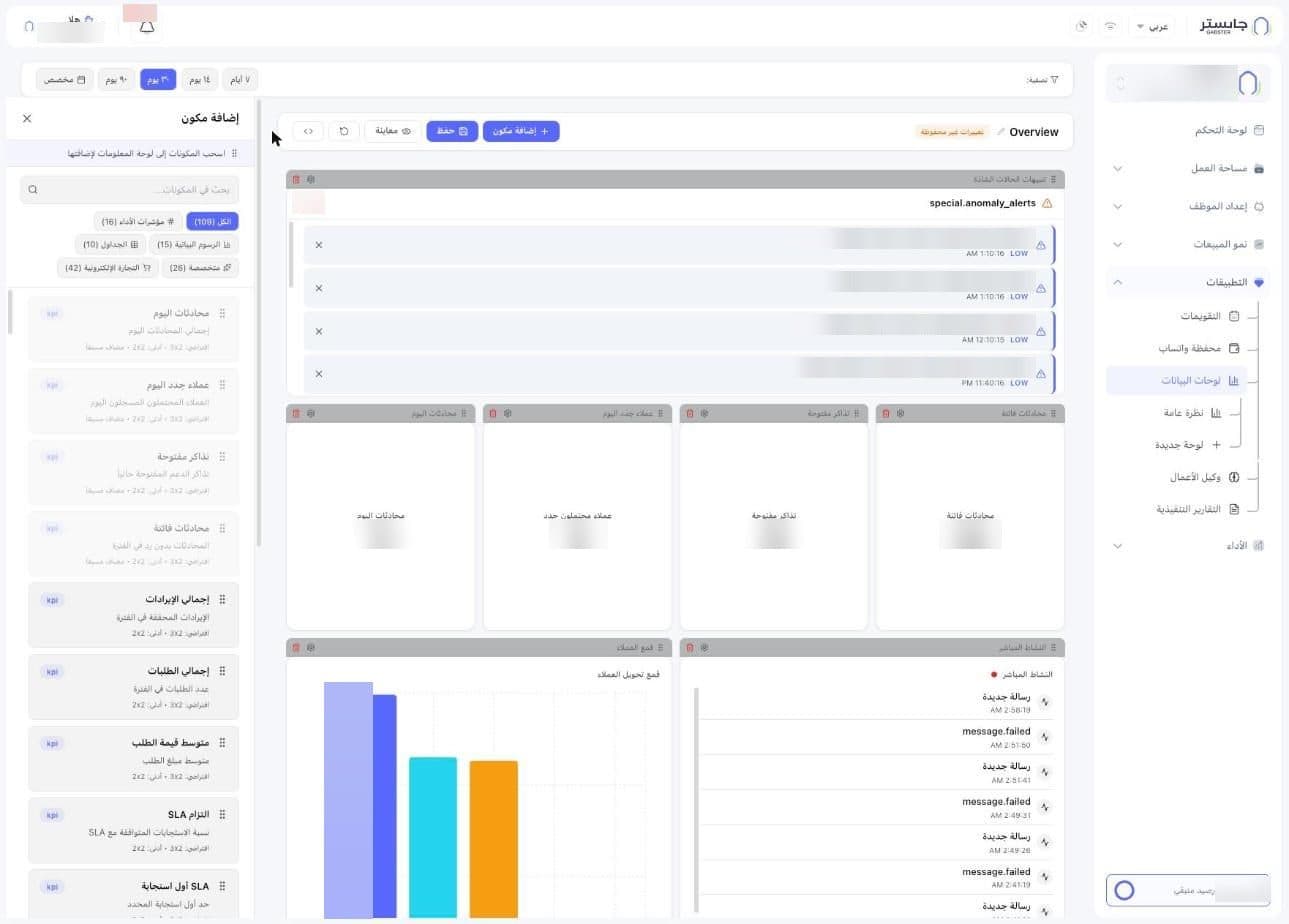
Click Edit (تعديل) to switch to edit mode. Each component gets a grey bar with:
- A drag handle (six dots) to move the component.
- A gear icon for the component's settings.
- A red delete icon to remove the component from the dashboard.
The edit toolbar holds:
- The dashboard name, with a pencil icon next to it.
- An Unsaved changes (تغييرات غير محفوظة) badge.
- Add component (إضافة مكون): open the component catalog.
- Save (حفظ): save the dashboard.
- Preview (معاينة).
- A circular-arrow icon and a code icon.
Add a component
- Click Add component (إضافة مكون) to open the side panel.
- Search by name in Search components… (بحث في المكونات...), or pick a category: All (الكل), KPIs (مؤشرات الأداء), Charts (الرسوم البيانية), Tables (الجداول), Specialized (متخصصة), E-commerce (التجارة الإلكترونية).
- Drag the component onto the dashboard to add it.
- Click Save (حفظ).
Each component in the list shows its name, a short description, and its default and minimum size on the grid. Components already on the dashboard are dimmed and marked Already added (مضاف مسبقًا).